|
Download Data (XLS File) |
|
||||||||
|
||||||||
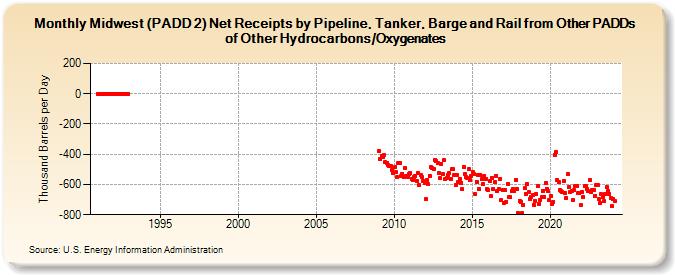
| Midwest (PADD 2) Net Receipts by Pipeline, Tanker, Barge and Rail from Other PADDs of Other Hydrocarbons/Oxygenates (Thousand Barrels per Day) | ||||||||
| Year | Jan | Feb | Mar | Apr | May | Jun | Jul | Aug | Sep | Oct | Nov | Dec |
|---|---|---|---|---|---|---|---|---|---|---|---|---|
| 1991 | 0 | 0 | 0 | 0 | 0 | 0 | 0 | 0 | 0 | 0 | 0 | 0 |
| 1992 | 0 | 0 | 0 | 0 | 0 | 0 | 0 | 0 | 0 | 0 | 0 | 0 |
| 2009 | -382 | -433 | -413 | -419 | -408 | -454 | -456 | -469 | -477 | -479 | -507 | -525 |
| 2010 | -487 | -520 | -551 | -460 | -455 | -543 | -528 | -552 | -488 | -543 | -548 | -534 |
| 2011 | -526 | -566 | -571 | -549 | -545 | -576 | -523 | -604 | -538 | -552 | -577 | -591 |
| 2012 | -698 | -572 | -598 | -545 | -486 | -493 | -498 | -436 | -444 | -460 | -522 | -557 |
| 2013 | -466 | -530 | -440 | -567 | -558 | -539 | -527 | -562 | -501 | -500 | -538 | -601 |
| 2014 | -535 | -585 | -567 | -587 | -630 | -485 | -532 | -552 | -557 | -498 | -568 | -542 |
| 2015 | -515 | -533 | -665 | -582 | -535 | -630 | -537 | -566 | -599 | -543 | -563 | -632 |
| 2016 | -637 | -574 | -678 | -556 | -629 | -585 | -542 | -644 | -627 | -561 | -706 | -638 |
| 2017 | -720 | -637 | -714 | -595 | -681 | -686 | -646 | -627 | -645 | -570 | -630 | -789 |
| 2018 | -708 | -715 | -789 | -735 | -624 | -660 | -597 | -653 | -695 | -682 | -670 | -734 |
| 2019 | -709 | -663 | -613 | -727 | -702 | -686 | -640 | -680 | -589 | -628 | -646 | -706 |
| 2020 | -673 | -732 | -714 | -402 | -386 | -572 | -586 | -637 | -645 | -648 | -575 | -658 |
| 2021 | -688 | -531 | -615 | -647 | -644 | -702 | -639 | -609 | -613 | -657 | -657 | -739 |
| 2022 | -651 | -684 | -613 | -611 | -629 | -646 | -573 | -652 | -634 | -635 | -674 | -602 |
| 2023 | -604 | -698 | -721 | -665 | -680 | -712 | -664 | -620 | -644 | -662 | -686 | -745 |
| 2024 | -704 | |||||||||||
| - = No Data Reported; -- = Not Applicable; NA = Not Available; W = Withheld to avoid disclosure of individual company data. |
| Release Date: 3/29/2024 |
| Next Release Date: 4/30/2024 |