|
Download Data (XLS File) |
|
||||||||
|
||||||||
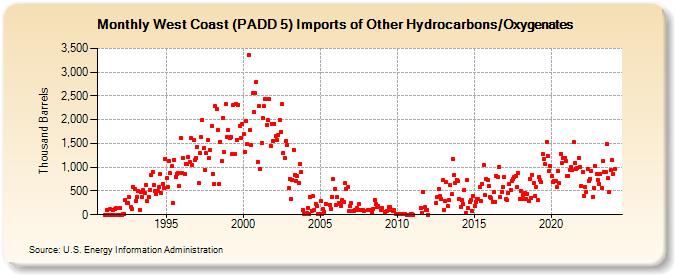
| West Coast (PADD 5) Imports of Other Hydrocarbons/Oxygenates (Thousand Barrels) | ||||||||
| Year | Jan | Feb | Mar | Apr | May | Jun | Jul | Aug | Sep | Oct | Nov | Dec |
|---|---|---|---|---|---|---|---|---|---|---|---|---|
| 1991 | 0 | 0 | 100 | 0 | 110 | 0 | 98 | 0 | 110 | 131 | 0 | 0 |
| 1992 | 137 | 0 | 17 | 16 | 302 | 245 | 251 | 372 | 161 | 120 | 592 | 532 |
| 1993 | 294 | 374 | 491 | 101 | 473 | 369 | 518 | 452 | 631 | 283 | 380 | 530 |
| 1994 | 828 | 902 | 620 | 490 | 438 | 502 | 575 | 865 | 458 | 654 | 562 | 1,176 |
| 1995 | 767 | 573 | 1,140 | 871 | 1,021 | 254 | 1,161 | 804 | 867 | 868 | 595 | 1,612 |
| 1996 | 881 | 1,191 | 867 | 1,067 | 1,057 | 1,215 | 1,102 | 1,606 | 1,052 | 1,563 | 1,143 | 1,200 |
| 1997 | 1,415 | 660 | 1,301 | 1,634 | 1,999 | 1,404 | 938 | 1,290 | 1,570 | 1,193 | 1,357 | 1,864 |
| 1998 | 862 | 653 | 2,279 | 2,222 | 1,781 | 648 | 1,532 | 1,135 | 2,043 | 1,311 | 2,332 | 1,632 |
| 1999 | 1,775 | 1,610 | 1,638 | 1,284 | 2,310 | 1,287 | 2,325 | 1,582 | 2,309 | 1,876 | 1,620 | 1,904 |
| 2000 | 1,692 | 1,322 | 1,966 | 1,493 | 3,351 | 1,777 | 1,466 | 2,556 | 2,157 | 2,555 | 2,795 | 1,113 |
| 2001 | 2,282 | 955 | 1,514 | 2,030 | 2,279 | 2,428 | 1,879 | 1,987 | 2,437 | 1,453 | 1,911 | 1,560 |
| 2002 | 1,919 | 1,649 | 1,567 | 1,681 | 2,002 | 1,751 | 2,320 | 1,301 | 1,194 | 1,555 | 1,477 | 552 |
| 2003 | 762 | 336 | 735 | 1,367 | 840 | 719 | 809 | 675 | 1,067 | 906 | 101 | 5 |
| 2004 | 9 | 31 | 143 | 12 | 375 | 79 | 384 | 103 | 232 | 181 | 12 | 12 |
| 2005 | 291 | 13 | 120 | 58 | 224 | 201 | 126 | 383 | 749 | 540 | ||
| 2006 | 204 | 368 | 255 | 228 | 189 | 319 | 268 | 659 | 542 | 575 | 78 | 182 |
| 2007 | 237 | 78 | 86 | 98 | 135 | 94 | 220 | 96 | 96 | 83 | ||
| 2008 | 97 | 95 | 96 | 50 | 128 | 319 | 219 | 164 | 188 | 100 | ||
| 2009 | 144 | 47 | 82 | 162 | 155 | 96 | 85 | 89 | 5 | |||
| 2010 | 12 | 11 | 12 | 11 | 12 | 14 | 7 | 2 | 3 | 7 | 6 | |
| 2011 | 2 | 138 | 42 | 484 | 156 | 94 | 94 | |||||
| 2012 | 1 | 243 | 374 | 542 | 386 | 338 | 720 | |||||
| 2013 | 101 | 292 | 683 | 177 | 301 | 634 | 427 | 1,175 | 832 | 658 | 738 | 705 |
| 2014 | 325 | 168 | 303 | 229 | 521 | 33 | 729 | 137 | 267 | 305 | 79 | 404 |
| 2015 | 180 | 278 | 324 | 324 | 576 | 286 | 656 | 1,045 | 417 | 755 | 725 | 594 |
| 2016 | 367 | 346 | 274 | 476 | 276 | 824 | 792 | 1,008 | 371 | 474 | 591 | 799 |
| 2017 | 323 | 320 | 456 | 636 | 524 | 717 | 751 | 793 | 808 | 581 | 875 | 329 |
| 2018 | 506 | 338 | 415 | 454 | 340 | 440 | 279 | 762 | 361 | 846 | 669 | 397 |
| 2019 | 591 | 309 | 789 | 725 | 683 | 1,276 | 1,167 | 1,063 | 1,535 | 1,244 | 924 | 1,026 |
| 2020 | 814 | 695 | 712 | 701 | 575 | 915 | 663 | 1,288 | 1,094 | 1,193 | 1,194 | 1,134 |
| 2021 | 823 | 822 | 932 | 1,001 | 931 | 1,539 | 1,083 | 971 | 983 | 1,190 | 1,001 | 608 |
| 2022 | 909 | 395 | 587 | 468 | 963 | 718 | 760 | 919 | 378 | 565 | 1,018 | 850 |
| 2023 | 737 | 648 | 857 | 564 | 1,121 | 903 | 904 | 1,488 | 770 | 478 | 938 | 1,146 |
| 2024 | 859 | |||||||||||
| - = No Data Reported; -- = Not Applicable; NA = Not Available; W = Withheld to avoid disclosure of individual company data. |
| Release Date: 3/29/2024 |
| Next Release Date: 4/30/2024 |