|
Download Data (XLS File) |
|
||||||||
|
||||||||
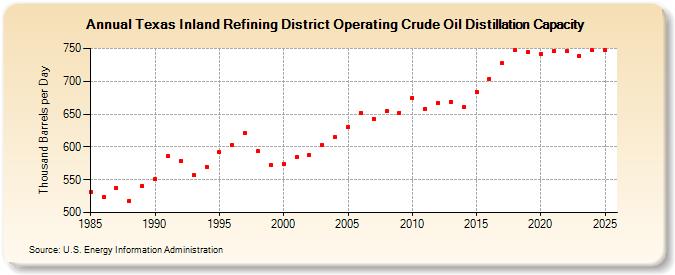
| Texas Inland Refining District Operating Crude Oil Distillation Capacity (Thousand Barrels per Day) | ||||||||
| Decade | Year-0 | Year-1 | Year-2 | Year-3 | Year-4 | Year-5 | Year-6 | Year-7 | Year-8 | Year-9 |
|---|---|---|---|---|---|---|---|---|---|---|
| 1980's | 531 | 524 | 538 | 518 | 541 | |||||
| 1990's | 551 | 586 | 579 | 557 | 570 | 592 | 603 | 621 | 593 | 572 |
| 2000's | 574 | 584 | 588 | 603 | 615 | 631 | 652 | 643 | 654 | 652 |
| 2010's | 675 | 658 | 667 | 669 | 660 | 684 | 704 | 727 | 747 | 745 |
| 2020's | 742 | 746 | 746 | 739 |
| - = No Data Reported; -- = Not Applicable; NA = Not Available; W = Withheld to avoid disclosure of individual company data. |
| Release Date: 4/30/2024 |
| Next Release Date: 8/30/2024 |