|
Download Data (XLS File) |
|
||||||||
|
||||||||
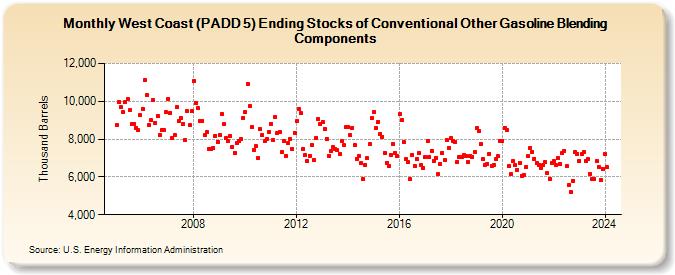
| West Coast (PADD 5) Ending Stocks of Conventional Other Gasoline Blending Components (Thousand Barrels) | ||||||||
| Year | Jan | Feb | Mar | Apr | May | Jun | Jul | Aug | Sep | Oct | Nov | Dec |
|---|---|---|---|---|---|---|---|---|---|---|---|---|
| 2005 | 8,732 | 9,955 | 9,681 | 9,425 | 9,949 | 10,126 | 9,516 | 8,790 | 8,811 | 8,579 | 8,458 | 9,257 |
| 2006 | 9,617 | 11,123 | 10,309 | 8,752 | 8,994 | 10,070 | 8,867 | 9,234 | 8,202 | 8,488 | 8,466 | 9,413 |
| 2007 | 10,134 | 9,402 | 8,038 | 8,203 | 9,684 | 8,959 | 9,130 | 8,791 | 7,944 | 9,483 | 8,725 | 9,461 |
| 2008 | 11,082 | 9,890 | 9,628 | 8,969 | 8,950 | 8,201 | 8,361 | 7,477 | 7,489 | 7,540 | 8,180 | 7,872 |
| 2009 | 8,218 | 9,328 | 8,776 | 8,051 | 7,898 | 8,170 | 7,572 | 7,267 | 7,818 | 7,887 | 7,986 | 9,141 |
| 2010 | 9,432 | 10,908 | 9,750 | 8,616 | 7,442 | 7,611 | 7,016 | 8,533 | 8,215 | 7,879 | 7,992 | 8,387 |
| 2011 | 8,811 | 7,955 | 9,163 | 8,331 | 8,369 | 7,306 | 7,887 | 7,118 | 7,802 | 8,002 | 7,458 | 8,337 |
| 2012 | 8,945 | 9,588 | 9,364 | 7,502 | 7,170 | 6,863 | 7,123 | 7,693 | 6,914 | 8,079 | 9,063 | 8,795 |
| 2013 | 8,906 | 8,559 | 8,022 | 7,113 | 7,349 | 7,591 | 7,465 | 7,403 | 7,223 | 7,873 | 7,673 | 8,650 |
| 2014 | 8,660 | 8,191 | 8,597 | 7,668 | 6,964 | 7,102 | 6,726 | 5,869 | 6,645 | 6,981 | 7,730 | 9,107 |
| 2015 | 9,455 | 8,571 | 8,928 | 8,270 | 8,133 | 7,288 | 6,761 | 6,579 | 7,162 | 7,735 | 7,262 | 7,109 |
| 2016 | 9,312 | 9,022 | 7,839 | 6,921 | 6,768 | 5,866 | 7,179 | 6,599 | 6,936 | 7,240 | 6,627 | 6,496 |
| 2017 | 7,059 | 7,895 | 7,070 | 7,390 | 6,842 | 7,018 | 6,131 | 6,698 | 7,278 | 6,883 | 7,930 | 7,543 |
| 2018 | 8,053 | 7,925 | 7,865 | 6,783 | 7,031 | 7,049 | 7,173 | 7,083 | 6,763 | 7,080 | 7,057 | 7,337 |
| 2019 | 8,580 | 8,430 | 7,729 | 6,940 | 6,608 | 6,694 | 7,229 | 6,597 | 6,634 | 6,951 | 7,081 | 7,918 |
| 2020 | 7,913 | 8,607 | 8,507 | 6,566 | 6,137 | 6,831 | 6,628 | 6,391 | 6,754 | 6,073 | 6,109 | 6,524 |
| 2021 | 7,081 | 7,534 | 7,343 | 6,963 | 6,731 | 6,643 | 6,475 | 6,624 | 6,797 | 6,192 | 5,914 | 6,748 |
| 2022 | 6,853 | 6,640 | 6,992 | 6,695 | 7,243 | 7,364 | 6,565 | 5,565 | 5,208 | 5,808 | 7,314 | 7,231 |
| 2023 | 6,835 | 7,206 | 7,298 | 6,831 | 6,947 | 6,161 | 5,913 | 5,909 | 6,850 | 6,522 | 5,838 | 6,442 |
| 2024 | 7,208 | |||||||||||
| - = No Data Reported; -- = Not Applicable; NA = Not Available; W = Withheld to avoid disclosure of individual company data. |
| Release Date: 3/29/2024 |
| Next Release Date: 4/30/2024 |