|
Download Data (XLS File) |
|
||||||||
|
||||||||
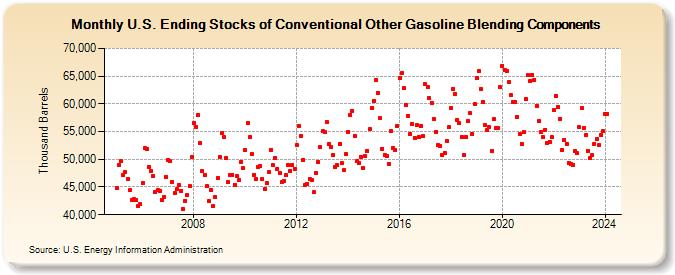
| U.S. Ending Stocks of Conventional Other Gasoline Blending Components (Thousand Barrels) | ||||||||
| Year | Jan | Feb | Mar | Apr | May | Jun | Jul | Aug | Sep | Oct | Nov | Dec |
|---|---|---|---|---|---|---|---|---|---|---|---|---|
| 2005 | 44,743 | 48,977 | 49,646 | 47,075 | 47,690 | 46,427 | 44,385 | 42,714 | 42,773 | 42,691 | 41,503 | 41,878 |
| 2006 | 45,765 | 51,974 | 51,886 | 48,645 | 47,879 | 47,040 | 44,051 | 44,488 | 44,294 | 42,724 | 43,152 | 46,886 |
| 2007 | 49,843 | 49,620 | 45,963 | 43,877 | 44,556 | 45,380 | 44,314 | 40,968 | 42,520 | 43,517 | 45,151 | 50,420 |
| 2008 | 56,527 | 55,871 | 58,016 | 52,865 | 47,860 | 47,205 | 45,118 | 42,410 | 44,498 | 41,565 | 43,171 | 46,624 |
| 2009 | 50,367 | 54,756 | 54,010 | 50,265 | 45,855 | 47,134 | 47,219 | 45,410 | 46,894 | 46,193 | 49,525 | 48,385 |
| 2010 | 51,759 | 56,519 | 53,943 | 50,867 | 47,241 | 46,453 | 48,689 | 48,775 | 46,480 | 44,568 | 45,669 | 47,699 |
| 2011 | 51,744 | 48,887 | 50,317 | 48,260 | 47,498 | 45,833 | 46,052 | 47,097 | 48,903 | 47,955 | 49,011 | 48,276 |
| 2012 | 52,601 | 56,079 | 54,259 | 49,951 | 45,439 | 45,555 | 46,529 | 46,248 | 44,016 | 47,586 | 49,589 | 52,247 |
| 2013 | 55,051 | 54,940 | 56,760 | 52,750 | 52,278 | 50,768 | 48,596 | 48,891 | 52,795 | 49,251 | 48,121 | 50,933 |
| 2014 | 54,970 | 58,043 | 58,735 | 54,266 | 49,672 | 49,347 | 50,449 | 48,450 | 50,543 | 51,501 | 55,372 | 59,316 |
| 2015 | 60,566 | 64,293 | 62,031 | 57,356 | 51,929 | 50,743 | 50,552 | 49,121 | 55,139 | 52,004 | 51,683 | 56,064 |
| 2016 | 64,571 | 65,539 | 62,773 | 59,811 | 57,809 | 54,535 | 56,426 | 53,899 | 56,156 | 54,083 | 55,979 | 54,169 |
| 2017 | 63,568 | 63,099 | 61,095 | 60,226 | 57,254 | 54,928 | 52,540 | 52,451 | 50,819 | 51,195 | 53,295 | 55,739 |
| 2018 | 59,328 | 62,686 | 61,806 | 57,080 | 56,483 | 54,107 | 50,734 | 54,057 | 56,929 | 58,298 | 54,539 | 59,913 |
| 2019 | 64,649 | 65,951 | 62,690 | 60,359 | 56,128 | 55,250 | 55,804 | 51,581 | 57,187 | 55,699 | 55,589 | 62,977 |
| 2020 | 66,873 | 66,166 | 65,949 | 63,926 | 61,531 | 60,381 | 60,373 | 57,671 | 54,621 | 52,838 | 54,834 | 60,827 |
| 2021 | 65,129 | 64,154 | 65,223 | 64,353 | 59,671 | 56,876 | 55,000 | 54,005 | 55,369 | 53,023 | 53,116 | 53,936 |
| 2022 | 58,907 | 61,450 | 59,492 | 57,302 | 51,589 | 53,515 | 52,840 | 49,375 | 49,159 | 49,041 | 51,458 | 51,084 |
| 2023 | 55,745 | 59,275 | 55,690 | 54,371 | 51,543 | 50,220 | 50,685 | 52,816 | 53,691 | 52,496 | 54,339 | 55,048 |
| 2024 | 58,255 | |||||||||||
| - = No Data Reported; -- = Not Applicable; NA = Not Available; W = Withheld to avoid disclosure of individual company data. |
| Release Date: 3/29/2024 |
| Next Release Date: 4/30/2024 |