|
Download Data (XLS File) |
|
||||||||
|
||||||||
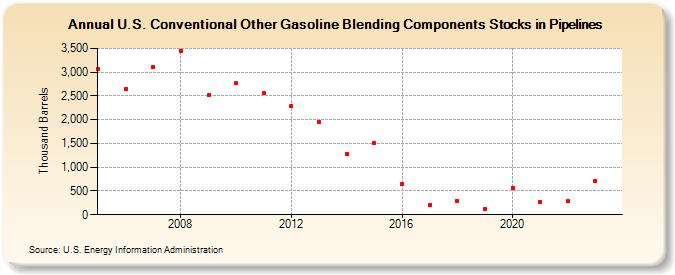
| U.S. Conventional Other Gasoline Blending Components Stocks in Pipelines (Thousand Barrels) | ||||||||
| Decade | Year-0 | Year-1 | Year-2 | Year-3 | Year-4 | Year-5 | Year-6 | Year-7 | Year-8 | Year-9 |
|---|---|---|---|---|---|---|---|---|---|---|
| 2000's | 3,069 | 2,638 | 3,115 | 3,447 | 2,514 | |||||
| 2010's | 2,766 | 2,566 | 2,281 | 1,951 | 1,288 | 1,505 | 656 | 208 | 282 | 128 |
| 2020's | 572 | 273 | 280 | 719 |
| - = No Data Reported; -- = Not Applicable; NA = Not Available; W = Withheld to avoid disclosure of individual company data. |
| Release Date: 8/30/2024 |
| Next Release Date: 8/29/2025 |