|
Download Data (XLS File) |
|
||||||||
|
||||||||
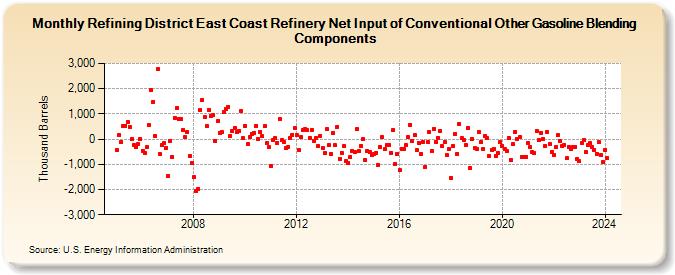
| Refining District East Coast Refinery Net Input of Conventional Other Gasoline Blending Components (Thousand Barrels) | ||||||||
| Year | Jan | Feb | Mar | Apr | May | Jun | Jul | Aug | Sep | Oct | Nov | Dec |
|---|---|---|---|---|---|---|---|---|---|---|---|---|
| 2005 | -447 | 167 | -109 | 534 | 537 | 686 | 487 | -1 | -239 | -323 | -187 | 13 |
| 2006 | -456 | -563 | -321 | 555 | 1,930 | 1,489 | 105 | 2,770 | -584 | -240 | -169 | -347 |
| 2007 | -1,470 | -57 | -694 | 850 | 1,226 | 786 | 782 | 365 | 66 | 272 | -664 | -966 |
| 2008 | -1,505 | -2,049 | -1,963 | 1,165 | 1,567 | 882 | 518 | 1,164 | 925 | 948 | -60 | 713 |
| 2009 | 249 | 264 | 1,056 | 1,200 | 1,281 | 138 | 308 | 454 | 281 | 319 | 1,119 | 27 |
| 2010 | 530 | -210 | 77 | 213 | 255 | 528 | 15 | 275 | 107 | 502 | -154 | -331 |
| 2011 | -1,080 | -52 | 47 | -137 | 782 | -48 | -115 | -355 | -310 | 41 | 174 | 437 |
| 2012 | 157 | -425 | 82 | 349 | 394 | 349 | 46 | 368 | -75 | 54 | -266 | 140 |
| 2013 | -353 | -564 | 392 | -243 | -586 | 244 | -252 | 499 | -776 | -538 | -280 | -875 |
| 2014 | -937 | -715 | -455 | -529 | 390 | -485 | -257 | 9 | -817 | -476 | -525 | -614 |
| 2015 | -601 | -543 | -1,008 | -298 | 65 | -404 | -239 | -232 | -532 | 353 | -984 | -576 |
| 2016 | -1,230 | -375 | -384 | -250 | 74 | 571 | -61 | 172 | -436 | -138 | -587 | -100 |
| 2017 | -1,120 | -126 | 299 | -474 | 411 | -102 | 60 | 329 | -284 | -128 | -628 | -404 |
| 2018 | -1,530 | -270 | 214 | -572 | 597 | 33 | -25 | -238 | 442 | -1,132 | 11 | -347 |
| 2019 | -381 | 281 | -109 | -385 | 133 | 24 | -664 | -416 | -392 | -661 | -542 | -117 |
| 2020 | -273 | -410 | -469 | 41 | -823 | -210 | 295 | 6 | 94 | -694 | -719 | -691 |
| 2021 | -147 | -331 | -521 | -559 | 319 | -33 | 242 | 5 | -255 | 295 | -199 | -520 |
| 2022 | -614 | -321 | 146 | -77 | -257 | -234 | -768 | -296 | -391 | -305 | -295 | -785 |
| 2023 | -888 | -150 | -32 | -511 | -246 | -156 | -306 | -427 | -572 | -121 | -649 | -923 |
| 2024 | -432 | |||||||||||
| - = No Data Reported; -- = Not Applicable; NA = Not Available; W = Withheld to avoid disclosure of individual company data. |
| Release Date: 3/29/2024 |
| Next Release Date: 4/30/2024 |