|
Download Data (XLS File) |
|
||||||||
|
||||||||
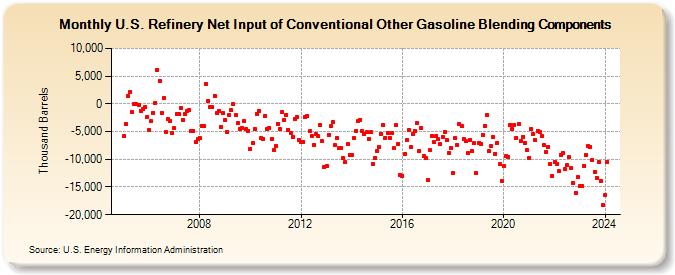
| U.S. Refinery Net Input of Conventional Other Gasoline Blending Components (Thousand Barrels) | ||||||||
| Year | Jan | Feb | Mar | Apr | May | Jun | Jul | Aug | Sep | Oct | Nov | Dec |
|---|---|---|---|---|---|---|---|---|---|---|---|---|
| 2005 | -5,855 | -3,683 | 1,375 | 2,214 | -1,407 | -75 | -92 | -158 | -1,246 | -923 | -604 | -2,378 |
| 2006 | -4,809 | -3,147 | -1,565 | 161 | 6,107 | 4,191 | -1,627 | 1,011 | -5,040 | -2,737 | -3,072 | -5,181 |
| 2007 | -4,409 | -1,810 | -1,893 | -703 | -2,899 | -1,764 | -1,249 | -1,120 | -4,873 | -4,907 | -6,907 | -6,416 |
| 2008 | -6,178 | -3,922 | -3,974 | 3,609 | 485 | -541 | -655 | 1,439 | -1,685 | -1,277 | -4,161 | -1,683 |
| 2009 | -2,957 | -5,051 | -1,951 | -1,159 | -34 | -1,929 | -3,545 | -4,510 | -4,322 | -3,179 | -4,542 | -4,842 |
| 2010 | -8,097 | -7,033 | -4,562 | -1,753 | -1,208 | -6,207 | -6,348 | -2,143 | -4,591 | -4,366 | -6,383 | -8,414 |
| 2011 | -7,573 | -3,571 | -4,466 | -1,484 | -2,879 | -1,969 | -4,754 | -5,216 | -5,910 | -2,770 | -2,411 | -6,459 |
| 2012 | -6,944 | -6,902 | -2,463 | -2,197 | -4,975 | -5,762 | -7,414 | -5,511 | -5,871 | -3,768 | -6,750 | -11,304 |
| 2013 | -11,220 | -5,568 | -4,056 | -3,342 | -7,499 | -6,216 | -8,024 | -8,008 | -9,853 | -10,538 | -7,278 | -9,170 |
| 2014 | -9,194 | -6,087 | -4,839 | -3,168 | -2,850 | -4,942 | -5,419 | -5,128 | -6,363 | -5,140 | -10,857 | -9,745 |
| 2015 | -8,498 | -7,768 | -5,415 | -3,854 | -6,111 | -5,351 | -6,150 | -5,295 | -8,035 | -3,834 | -7,173 | -12,794 |
| 2016 | -12,953 | -9,097 | -6,513 | -4,764 | -7,756 | -5,369 | -4,837 | -3,378 | -8,418 | -4,357 | -9,365 | -9,803 |
| 2017 | -13,780 | -8,392 | -5,769 | -6,855 | -5,844 | -6,424 | -7,282 | -5,898 | -5,019 | -6,505 | -8,791 | -7,931 |
| 2018 | -12,439 | -6,147 | -7,424 | -3,680 | -4,034 | -6,427 | -6,785 | -8,905 | -6,563 | -8,536 | -7,080 | -12,497 |
| 2019 | -7,077 | -7,187 | -5,537 | -3,929 | -2,055 | -8,561 | -7,692 | -6,003 | -8,966 | -6,995 | -10,880 | -13,887 |
| 2020 | -11,235 | -9,499 | -9,547 | -3,766 | -4,535 | -3,839 | -6,094 | -3,607 | -6,715 | -5,970 | -6,993 | -8,340 |
| 2021 | -9,684 | -4,522 | -5,422 | -6,582 | -4,817 | -5,027 | -5,723 | -7,473 | -8,707 | -7,736 | -10,918 | -12,997 |
| 2022 | -10,524 | -10,779 | -12,135 | -9,179 | -8,877 | -11,806 | -11,094 | -9,632 | -11,571 | -14,297 | -16,033 | -13,251 |
| 2023 | -14,893 | -14,789 | -11,160 | -9,221 | -7,614 | -7,749 | -10,052 | -12,224 | -13,331 | -10,481 | -13,901 | -18,297 |
| 2024 | -16,520 | |||||||||||
| - = No Data Reported; -- = Not Applicable; NA = Not Available; W = Withheld to avoid disclosure of individual company data. |
| Release Date: 3/29/2024 |
| Next Release Date: 4/30/2024 |