|
Download Data (XLS File) |
|
||||||||
|
||||||||
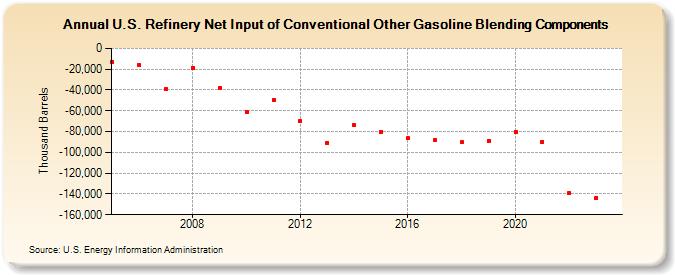
| U.S. Refinery Net Input of Conventional Other Gasoline Blending Components (Thousand Barrels) | ||||||||
| Decade | Year-0 | Year-1 | Year-2 | Year-3 | Year-4 | Year-5 | Year-6 | Year-7 | Year-8 | Year-9 |
|---|---|---|---|---|---|---|---|---|---|---|
| 2000's | -12,832 | -15,708 | -38,950 | -18,543 | -38,021 | |||||
| 2010's | -61,105 | -49,462 | -69,861 | -90,772 | -73,732 | -80,278 | -86,610 | -88,490 | -90,517 | -88,769 |
| 2020's | -80,140 | -89,608 | -139,178 | -143,712 |
| - = No Data Reported; -- = Not Applicable; NA = Not Available; W = Withheld to avoid disclosure of individual company data. |
| Release Date: 4/30/2024 |
| Next Release Date: 8/30/2024 |