|
Download Data (XLS File) |
|
||||||||
|
||||||||
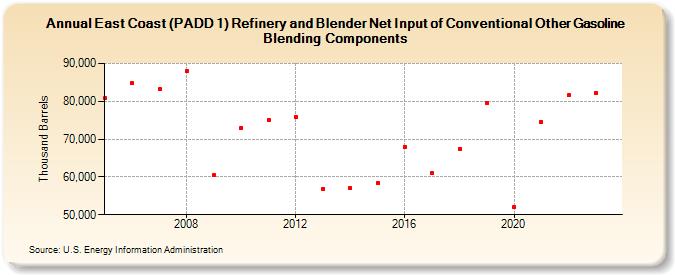
| East Coast (PADD 1) Refinery and Blender Net Input of Conventional Other Gasoline Blending Components (Thousand Barrels) | ||||||||
| Decade | Year-0 | Year-1 | Year-2 | Year-3 | Year-4 | Year-5 | Year-6 | Year-7 | Year-8 | Year-9 |
|---|---|---|---|---|---|---|---|---|---|---|
| 2000's | 80,788 | 84,771 | 83,120 | 87,989 | 60,426 | |||||
| 2010's | 73,046 | 75,150 | 75,753 | 56,919 | 57,025 | 58,420 | 67,995 | 60,914 | 67,474 | 79,665 |
| 2020's | 52,062 | 74,606 | 81,583 | 82,255 |
| - = No Data Reported; -- = Not Applicable; NA = Not Available; W = Withheld to avoid disclosure of individual company data. |
| Release Date: 3/29/2024 |
| Next Release Date: 8/30/2024 |