|
Download Data (XLS File) |
|
||||||||
|
||||||||
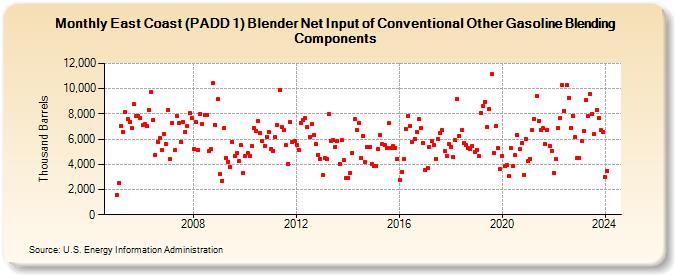
| East Coast (PADD 1) Blender Net Input of Conventional Other Gasoline Blending Components (Thousand Barrels) | ||||||||
| Year | Jan | Feb | Mar | Apr | May | Jun | Jul | Aug | Sep | Oct | Nov | Dec |
|---|---|---|---|---|---|---|---|---|---|---|---|---|
| 2005 | 1,581 | 2,534 | 7,060 | 6,550 | 8,116 | 7,561 | 7,337 | 6,858 | 8,763 | 7,816 | 7,831 | 7,675 |
| 2006 | 7,091 | 7,163 | 7,023 | 8,287 | 9,755 | 7,535 | 4,774 | 5,801 | 6,074 | 5,103 | 6,421 | 5,598 |
| 2007 | 8,324 | 4,413 | 7,314 | 5,113 | 7,859 | 7,238 | 5,744 | 7,371 | 6,570 | 7,006 | 8,050 | 7,656 |
| 2008 | 5,242 | 7,348 | 5,173 | 7,999 | 7,175 | 7,900 | 7,894 | 5,048 | 5,187 | 10,443 | 7,104 | 9,169 |
| 2009 | 3,203 | 2,701 | 6,876 | 4,534 | 4,221 | 3,818 | 5,784 | 4,691 | 4,884 | 4,229 | 5,514 | 3,275 |
| 2010 | 4,679 | 4,870 | 4,690 | 5,468 | 6,890 | 6,638 | 7,436 | 6,518 | 5,819 | 5,445 | 6,197 | 6,553 |
| 2011 | 5,244 | 5,080 | 6,149 | 7,156 | 9,873 | 6,957 | 6,733 | 5,522 | 4,049 | 7,320 | 5,784 | 5,829 |
| 2012 | 5,564 | 5,154 | 7,299 | 7,482 | 7,680 | 6,962 | 6,132 | 7,203 | 6,348 | 5,576 | 4,734 | 4,410 |
| 2013 | 3,120 | 4,519 | 4,418 | 8,006 | 5,877 | 5,891 | 5,398 | 5,821 | 4,025 | 5,903 | 4,306 | 2,917 |
| 2014 | 2,937 | 3,348 | 4,921 | 7,565 | 6,702 | 7,272 | 4,531 | 6,232 | 4,149 | 5,398 | 5,340 | 4,049 |
| 2015 | 3,856 | 3,837 | 5,217 | 6,304 | 5,595 | 5,561 | 5,259 | 7,241 | 5,282 | 5,427 | 5,308 | 4,405 |
| 2016 | 2,749 | 3,409 | 4,433 | 6,815 | 7,797 | 7,045 | 5,735 | 6,022 | 6,553 | 7,565 | 6,875 | 5,688 |
| 2017 | 3,553 | 3,704 | 5,389 | 5,861 | 5,540 | 4,457 | 6,000 | 6,472 | 6,690 | 5,026 | 4,686 | 5,647 |
| 2018 | 5,347 | 4,558 | 5,926 | 9,162 | 6,266 | 6,749 | 5,674 | 5,541 | 5,274 | 5,212 | 5,492 | 4,987 |
| 2019 | 5,145 | 4,652 | 8,081 | 8,612 | 8,977 | 6,942 | 8,413 | 11,143 | 4,879 | 7,064 | 5,325 | 3,599 |
| 2020 | 4,666 | 3,828 | 3,978 | 3,039 | 5,309 | 3,869 | 4,742 | 6,361 | 5,230 | 5,703 | 3,189 | 6,014 |
| 2021 | 4,263 | 4,453 | 6,702 | 7,604 | 9,424 | 7,445 | 6,756 | 6,841 | 5,574 | 6,717 | 5,478 | 5,082 |
| 2022 | 3,313 | 4,406 | 6,919 | 7,684 | 10,324 | 8,265 | 10,259 | 9,297 | 6,849 | 7,860 | 6,154 | 4,462 |
| 2023 | 4,510 | 5,848 | 6,661 | 9,096 | 7,813 | 9,578 | 8,031 | 6,373 | 8,327 | 7,679 | 6,712 | 6,594 |
| 2024 | 2,985 | |||||||||||
| - = No Data Reported; -- = Not Applicable; NA = Not Available; W = Withheld to avoid disclosure of individual company data. |
| Release Date: 3/29/2024 |
| Next Release Date: 4/30/2024 |