|
Download Data (XLS File) |
|
||||||||
|
||||||||
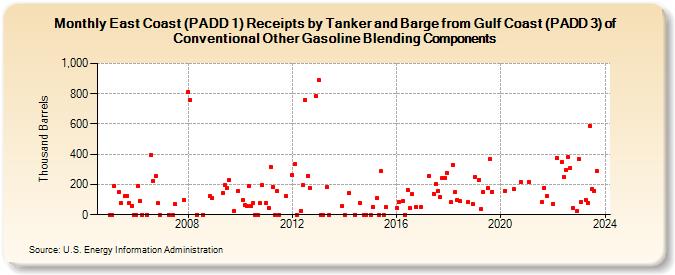
| East Coast (PADD 1) Receipts by Tanker and Barge from Gulf Coast (PADD 3) of Conventional Other Gasoline Blending Components (Thousand Barrels) | ||||||||
| Year | Jan | Feb | Mar | Apr | May | Jun | Jul | Aug | Sep | Oct | Nov | Dec |
|---|---|---|---|---|---|---|---|---|---|---|---|---|
| 2005 | 0 | 0 | 190 | 148 | 79 | 125 | 125 | 76 | 55 | 0 | ||
| 2006 | 0 | 192 | 90 | 0 | 0 | 397 | 220 | 255 | 75 | 0 | ||
| 2007 | 0 | 0 | 69 | 100 | ||||||||
| 2008 | 813 | 756 | 0 | 0 | 121 | 109 | ||||||
| 2009 | 142 | 199 | 176 | 230 | 26 | 159 | ||||||
| 2010 | 94 | 61 | 60 | 187 | 59 | 79 | 0 | 0 | 76 | 194 | ||
| 2011 | 80 | 46 | 318 | 182 | 0 | 160 | 0 | 122 | ||||
| 2012 | 262 | 334 | 0 | 25 | 195 | 760 | 258 | 175 | 782 | |||
| 2013 | 890 | 0 | 0 | 180 | 0 | 59 | ||||||
| 2014 | 0 | 142 | 0 | 79 | 0 | 0 | ||||||
| 2015 | 0 | 50 | 109 | 0 | 286 | 0 | 50 | |||||
| 2016 | 47 | 84 | 89 | 0 | 164 | 43 | 135 | 51 | 50 | |||
| 2017 | 259 | 140 | 202 | 159 | 119 | 240 | 242 | 278 | ||||
| 2018 | 81 | 332 | 151 | 100 | 91 | 84 | 70 | |||||
| 2019 | 250 | 232 | 37 | 150 | 176 | 367 | 152 | |||||
| 2020 | 160 | 170 | 218 | |||||||||
| 2021 | 215 | 83 | 179 | 123 | ||||||||
| 2022 | 74 | 374 | 349 | 251 | 298 | 382 | 312 | 44 | 22 | |||
| 2023 | 367 | 86 | 100 | 78 | 587 | 168 | 160 | 291 | ||||
| 2024 | 289 | |||||||||||
| - = No Data Reported; -- = Not Applicable; NA = Not Available; W = Withheld to avoid disclosure of individual company data. |
| Release Date: 8/30/2024 |
| Next Release Date: 9/30/2024 |