|
Download Data (XLS File) |
|
||||||||
|
||||||||
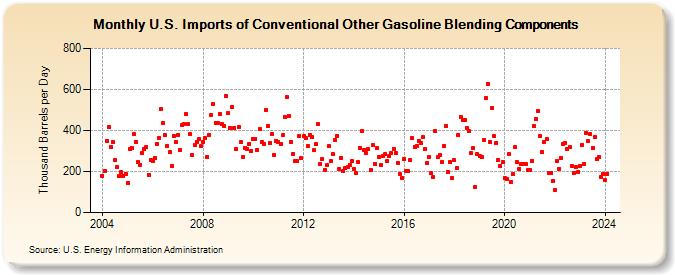
| U.S. Imports of Conventional Other Gasoline Blending Components (Thousand Barrels per Day) | ||||||||
| Year | Jan | Feb | Mar | Apr | May | Jun | Jul | Aug | Sep | Oct | Nov | Dec |
|---|---|---|---|---|---|---|---|---|---|---|---|---|
| 2004 | 180 | 203 | 350 | 419 | 320 | 342 | 256 | 222 | 179 | 196 | 180 | 190 |
| 2005 | 146 | 308 | 314 | 381 | 345 | 245 | 234 | 291 | 308 | 320 | 185 | 255 |
| 2006 | 249 | 265 | 336 | 364 | 504 | 438 | 379 | 324 | 293 | 227 | 374 | 344 |
| 2007 | 380 | 305 | 426 | 431 | 481 | 430 | 383 | 279 | 330 | 346 | 360 | 323 |
| 2008 | 344 | 363 | 271 | 380 | 477 | 528 | 436 | 437 | 481 | 430 | 424 | 567 |
| 2009 | 485 | 410 | 513 | 413 | 309 | 417 | 343 | 272 | 317 | 311 | 336 | 299 |
| 2010 | 360 | 360 | 304 | 408 | 345 | 336 | 502 | 421 | 337 | 383 | 282 | 351 |
| 2011 | 344 | 332 | 376 | 468 | 561 | 469 | 346 | 287 | 249 | 249 | 375 | 264 |
| 2012 | 372 | 362 | 325 | 380 | 366 | 304 | 332 | 430 | 235 | 261 | 209 | 230 |
| 2013 | 323 | 251 | 283 | 353 | 372 | 213 | 267 | 201 | 217 | 220 | 234 | 250 |
| 2014 | 213 | 191 | 246 | 316 | 396 | 307 | 289 | 309 | 207 | 327 | 239 | 313 |
| 2015 | 269 | 230 | 275 | 284 | 250 | 276 | 288 | 311 | 288 | 243 | 189 | 168 |
| 2016 | 262 | 202 | 201 | 256 | 364 | 321 | 325 | 348 | 339 | 368 | 309 | 242 |
| 2017 | 271 | 191 | 172 | 397 | 271 | 280 | 246 | 324 | 421 | 200 | 245 | 170 |
| 2018 | 254 | 216 | 377 | 467 | 452 | 452 | 410 | 396 | 291 | 313 | 125 | 284 |
| 2019 | 277 | 269 | 352 | 558 | 627 | 345 | 511 | 371 | 340 | 257 | 227 | 245 |
| 2020 | 170 | 165 | 283 | 149 | 187 | 320 | 244 | 213 | 238 | 238 | 235 | 205 |
| 2021 | 209 | 253 | 421 | 455 | 497 | 373 | 296 | 343 | 358 | 192 | 192 | 153 |
| 2022 | 108 | 250 | 214 | 267 | 333 | 339 | 310 | 319 | 228 | 195 | 222 | 200 |
| 2023 | 229 | 328 | 238 | 390 | 347 | 382 | 315 | 366 | 260 | 270 | 175 | 189 |
| 2024 | 157 | |||||||||||
| - = No Data Reported; -- = Not Applicable; NA = Not Available; W = Withheld to avoid disclosure of individual company data. |
| Release Date: 3/29/2024 |
| Next Release Date: 4/30/2024 |