|
Download Data (XLS File) |
|
||||||||
|
||||||||
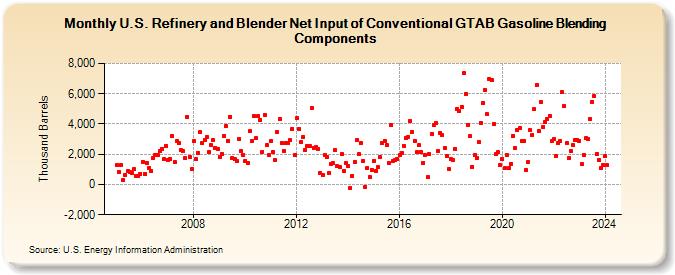
| U.S. Refinery and Blender Net Input of Conventional GTAB Gasoline Blending Components (Thousand Barrels) | ||||||||
| Year | Jan | Feb | Mar | Apr | May | Jun | Jul | Aug | Sep | Oct | Nov | Dec |
|---|---|---|---|---|---|---|---|---|---|---|---|---|
| 2005 | 1,299 | 848 | 1,286 | 284 | 638 | 889 | 838 | 755 | 1,002 | 575 | 569 | 709 |
| 2006 | 1,516 | 724 | 1,445 | 1,086 | 874 | 1,769 | 1,952 | 1,926 | 2,209 | 2,369 | 1,697 | 2,575 |
| 2007 | 1,649 | 1,698 | 3,214 | 1,480 | 2,868 | 2,730 | 2,271 | 2,195 | 1,763 | 4,470 | 1,841 | 1,029 |
| 2008 | 2,843 | 1,662 | 2,104 | 3,464 | 2,767 | 2,963 | 3,165 | 2,172 | 2,591 | 2,923 | 2,430 | 2,371 |
| 2009 | 1,827 | 2,016 | 3,221 | 3,835 | 2,898 | 4,485 | 1,724 | 1,655 | 1,550 | 3,036 | 2,226 | 1,962 |
| 2010 | 1,562 | 1,414 | 3,512 | 2,864 | 4,511 | 3,061 | 4,522 | 4,246 | 2,167 | 4,617 | 2,581 | 1,932 |
| 2011 | 2,854 | 2,122 | 1,595 | 3,501 | 4,323 | 2,747 | 2,220 | 2,736 | 2,743 | 2,908 | 3,696 | 1,940 |
| 2012 | 4,386 | 3,682 | 2,814 | 3,162 | 2,267 | 2,539 | 2,522 | 5,073 | 2,430 | 2,446 | 2,369 | 769 |
| 2013 | 619 | 1,931 | 1,801 | 743 | 1,377 | 1,409 | 2,276 | 1,203 | 1,155 | 1,998 | 879 | 1,414 |
| 2014 | 1,214 | -227 | 585 | 1,488 | 2,927 | 1,995 | 2,720 | 1,578 | -143 | 1,091 | 498 | 960 |
| 2015 | 1,578 | 913 | 1,126 | 1,832 | 2,713 | 2,865 | 2,614 | 1,413 | 3,907 | 1,559 | 1,644 | 1,694 |
| 2016 | 1,921 | 2,110 | 2,567 | 3,090 | 3,167 | 4,200 | 3,492 | 2,906 | 2,122 | 2,579 | 2,165 | 1,450 |
| 2017 | 1,974 | 484 | 2,001 | 3,341 | 3,920 | 4,079 | 2,205 | 3,412 | 3,262 | 2,416 | 1,913 | 1,028 |
| 2018 | 1,695 | 1,604 | 2,360 | 5,021 | 4,873 | 5,153 | 7,350 | 5,989 | 3,949 | 3,192 | 1,183 | 1,929 |
| 2019 | 1,767 | 2,813 | 4,096 | 5,391 | 6,245 | 4,641 | 6,984 | 6,904 | 4,028 | 2,002 | 2,117 | 1,270 |
| 2020 | 1,655 | 1,071 | 1,944 | 1,060 | 1,367 | 3,229 | 2,396 | 3,582 | 3,715 | 2,869 | 2,885 | 963 |
| 2021 | 1,492 | 3,596 | 3,283 | 4,962 | 6,568 | 3,545 | 5,427 | 3,795 | 4,131 | 4,311 | 4,514 | 2,852 |
| 2022 | 2,989 | 1,863 | 2,714 | 2,864 | 6,111 | 5,164 | 2,712 | 1,748 | 2,207 | 2,618 | 2,952 | 2,951 |
| 2023 | 2,884 | 1,329 | 1,932 | 3,048 | 3,009 | 4,323 | 5,483 | 5,846 | 1,998 | 1,630 | 1,074 | 1,274 |
| 2024 | 1,879 | |||||||||||
| - = No Data Reported; -- = Not Applicable; NA = Not Available; W = Withheld to avoid disclosure of individual company data. |
| Release Date: 3/29/2024 |
| Next Release Date: 4/30/2024 |