|
Download Data (XLS File) |
|
||||||||
|
||||||||
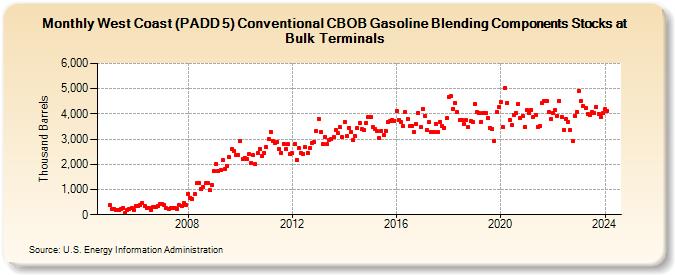
| West Coast (PADD 5) Conventional CBOB Gasoline Blending Components Stocks at Bulk Terminals (Thousand Barrels) | ||||||||
| Year | Jan | Feb | Mar | Apr | May | Jun | Jul | Aug | Sep | Oct | Nov | Dec |
|---|---|---|---|---|---|---|---|---|---|---|---|---|
| 2005 | 369 | 226 | 225 | 189 | 170 | 211 | 259 | 66 | 193 | 235 | 260 | 170 |
| 2006 | 355 | 352 | 380 | 458 | 328 | 266 | 270 | 202 | 325 | 287 | 344 | 444 |
| 2007 | 417 | 402 | 254 | 228 | 274 | 271 | 251 | 239 | 383 | 352 | 448 | 402 |
| 2008 | 841 | 681 | 629 | 823 | 1,242 | 1,269 | 1,019 | 1,110 | 1,241 | 1,263 | 965 | 1,185 |
| 2009 | 1,725 | 2,005 | 1,742 | 1,763 | 2,158 | 1,824 | 1,940 | 2,272 | 2,606 | 2,511 | 2,374 | 2,370 |
| 2010 | 2,918 | 2,210 | 2,242 | 2,210 | 2,395 | 2,058 | 2,369 | 2,000 | 2,455 | 2,610 | 2,322 | 2,463 |
| 2011 | 2,674 | 2,992 | 3,282 | 2,910 | 2,852 | 2,867 | 2,612 | 2,464 | 2,816 | 2,608 | 2,799 | 2,389 |
| 2012 | 2,434 | 2,805 | 2,183 | 2,652 | 2,440 | 2,421 | 2,676 | 2,459 | 2,640 | 2,857 | 2,887 | 3,306 |
| 2013 | 3,802 | 3,285 | 2,807 | 3,084 | 2,786 | 2,958 | 2,988 | 3,067 | 3,368 | 3,239 | 3,461 | 3,072 |
| 2014 | 3,683 | 3,112 | 3,458 | 3,268 | 2,968 | 3,122 | 3,437 | 3,646 | 3,381 | 3,351 | 3,654 | 3,872 |
| 2015 | 3,872 | 3,488 | 3,414 | 3,304 | 3,043 | 3,327 | 3,148 | 3,340 | 3,679 | 3,705 | 3,757 | 3,729 |
| 2016 | 4,130 | 3,771 | 3,671 | 3,514 | 4,074 | 3,798 | 3,508 | 3,525 | 3,294 | 3,607 | 4,054 | 3,469 |
| 2017 | 4,205 | 3,925 | 3,360 | 3,668 | 3,294 | 3,271 | 3,602 | 3,272 | 3,693 | 3,515 | 3,457 | 3,820 |
| 2018 | 4,675 | 4,709 | 4,207 | 4,433 | 4,073 | 3,754 | 3,738 | 3,588 | 3,765 | 3,474 | 3,702 | 3,666 |
| 2019 | 4,385 | 4,065 | 4,042 | 3,684 | 4,047 | 4,028 | 3,849 | 3,452 | 3,404 | 2,916 | 4,081 | 4,269 |
| 2020 | 4,461 | 3,464 | 5,031 | 4,446 | 3,756 | 3,575 | 3,966 | 4,038 | 4,407 | 3,826 | 3,898 | 3,471 |
| 2021 | 4,144 | 4,019 | 4,159 | 3,871 | 3,962 | 3,479 | 3,516 | 4,425 | 4,500 | 4,502 | 4,076 | 3,790 |
| 2022 | 4,036 | 4,157 | 3,921 | 4,519 | 3,894 | 3,371 | 3,792 | 3,680 | 3,352 | 2,919 | 3,920 | 4,085 |
| 2023 | 4,923 | 4,510 | 4,296 | 4,222 | 4,005 | 3,941 | 4,091 | 4,039 | 4,273 | 4,015 | 3,858 | 4,020 |
| 2024 | 4,195 | |||||||||||
| - = No Data Reported; -- = Not Applicable; NA = Not Available; W = Withheld to avoid disclosure of individual company data. |
| Release Date: 3/29/2024 |
| Next Release Date: 4/30/2024 |