|
Download Data (XLS File) |
|
||||||||
|
||||||||
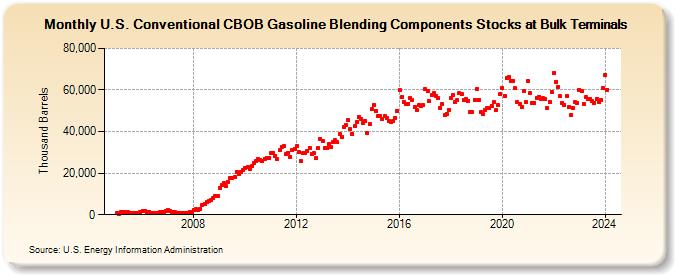
| U.S. Conventional CBOB Gasoline Blending Components Stocks at Bulk Terminals (Thousand Barrels) | ||||||||
| Year | Jan | Feb | Mar | Apr | May | Jun | Jul | Aug | Sep | Oct | Nov | Dec |
|---|---|---|---|---|---|---|---|---|---|---|---|---|
| 2005 | 705 | 439 | 1,182 | 1,259 | 1,133 | 1,178 | 770 | 627 | 725 | 777 | 914 | 1,434 |
| 2006 | 1,841 | 1,912 | 1,522 | 1,464 | 967 | 852 | 947 | 861 | 1,295 | 1,503 | 1,505 | 1,928 |
| 2007 | 2,128 | 1,755 | 1,485 | 1,087 | 845 | 774 | 775 | 895 | 1,040 | 1,065 | 1,351 | 1,542 |
| 2008 | 2,419 | 2,523 | 2,072 | 2,836 | 4,839 | 4,923 | 6,173 | 6,422 | 7,014 | 7,909 | 8,791 | 9,165 |
| 2009 | 13,022 | 14,127 | 15,126 | 13,664 | 15,954 | 17,851 | 17,689 | 18,172 | 20,781 | 19,650 | 20,720 | 21,732 |
| 2010 | 22,577 | 22,780 | 21,905 | 23,325 | 24,723 | 25,964 | 26,817 | 26,496 | 25,673 | 27,032 | 27,361 | 27,255 |
| 2011 | 29,745 | 29,809 | 28,263 | 26,715 | 31,105 | 32,744 | 32,929 | 29,196 | 29,705 | 27,855 | 31,163 | 31,637 |
| 2012 | 32,841 | 29,981 | 25,886 | 29,484 | 29,592 | 30,870 | 32,310 | 29,115 | 29,623 | 27,368 | 32,179 | 36,587 |
| 2013 | 35,398 | 32,320 | 32,254 | 33,961 | 32,493 | 34,889 | 35,790 | 34,769 | 38,666 | 37,422 | 42,083 | 43,329 |
| 2014 | 45,423 | 41,071 | 38,865 | 42,623 | 44,509 | 46,795 | 46,095 | 43,885 | 44,984 | 39,175 | 43,626 | 50,623 |
| 2015 | 52,756 | 49,808 | 47,347 | 47,249 | 45,861 | 47,451 | 46,731 | 45,057 | 44,369 | 44,888 | 46,752 | 49,909 |
| 2016 | 59,992 | 56,530 | 54,166 | 53,364 | 53,425 | 56,098 | 55,069 | 51,627 | 50,363 | 52,668 | 52,148 | 52,657 |
| 2017 | 60,240 | 59,652 | 54,520 | 57,547 | 58,616 | 57,242 | 55,935 | 51,434 | 53,196 | 47,822 | 48,476 | 50,541 |
| 2018 | 56,152 | 57,656 | 53,991 | 55,099 | 58,533 | 57,837 | 55,203 | 55,624 | 54,754 | 49,265 | 49,240 | 55,086 |
| 2019 | 60,487 | 55,356 | 49,393 | 48,272 | 50,309 | 51,105 | 51,271 | 52,432 | 54,029 | 50,230 | 52,531 | 57,913 |
| 2020 | 60,998 | 57,338 | 65,660 | 66,049 | 64,334 | 64,486 | 60,729 | 54,025 | 53,175 | 51,969 | 59,272 | 54,125 |
| 2021 | 64,145 | 58,381 | 53,959 | 53,773 | 56,175 | 56,725 | 55,708 | 55,924 | 55,619 | 51,230 | 54,399 | 59,235 |
| 2022 | 68,110 | 63,972 | 61,526 | 57,070 | 53,620 | 52,745 | 57,066 | 51,726 | 48,121 | 51,442 | 53,977 | 53,713 |
| 2023 | 60,186 | 59,550 | 53,428 | 56,513 | 55,581 | 55,816 | 54,499 | 53,817 | 55,870 | 54,020 | 54,944 | 60,899 |
| 2024 | 67,294 | |||||||||||
| - = No Data Reported; -- = Not Applicable; NA = Not Available; W = Withheld to avoid disclosure of individual company data. |
| Release Date: 3/29/2024 |
| Next Release Date: 4/30/2024 |