|
Download Data (XLS File) |
|
||||||||
|
||||||||
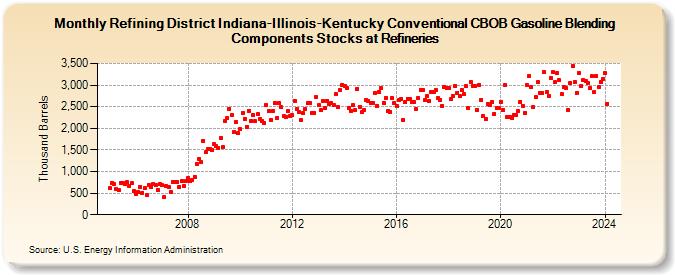
| Refining District Indiana-Illinois-Kentucky Conventional CBOB Gasoline Blending Components Stocks at Refineries (Thousand Barrels) | ||||||||
| Year | Jan | Feb | Mar | Apr | May | Jun | Jul | Aug | Sep | Oct | Nov | Dec |
|---|---|---|---|---|---|---|---|---|---|---|---|---|
| 2005 | 608 | 734 | 708 | 600 | 562 | 740 | 745 | 722 | 751 | 666 | 724 | 545 |
| 2006 | 479 | 527 | 649 | 512 | 618 | 446 | 685 | 630 | 701 | 699 | 576 | 712 |
| 2007 | 680 | 412 | 660 | 640 | 537 | 767 | 748 | 753 | 650 | 773 | 669 | 785 |
| 2008 | 857 | 788 | 807 | 879 | 1,174 | 1,288 | 1,210 | 1,713 | 1,444 | 1,525 | 1,525 | 1,504 |
| 2009 | 1,632 | 1,583 | 1,550 | 1,771 | 1,562 | 2,177 | 2,229 | 2,455 | 2,307 | 1,905 | 2,156 | 1,881 |
| 2010 | 1,976 | 2,354 | 2,218 | 2,040 | 2,409 | 2,175 | 2,309 | 2,162 | 2,327 | 2,215 | 2,168 | 2,123 |
| 2011 | 2,536 | 2,396 | 2,192 | 2,405 | 2,584 | 2,248 | 2,582 | 2,487 | 2,274 | 2,255 | 2,406 | 2,279 |
| 2012 | 2,300 | 2,634 | 2,454 | 2,370 | 2,184 | 2,357 | 2,442 | 2,580 | 2,581 | 2,350 | 2,349 | 2,726 |
| 2013 | 2,531 | 2,420 | 2,624 | 2,463 | 2,643 | 2,554 | 2,579 | 2,543 | 2,784 | 2,492 | 2,887 | 3,004 |
| 2014 | 2,978 | 2,933 | 2,476 | 2,394 | 2,529 | 2,414 | 2,914 | 2,499 | 2,369 | 2,421 | 2,655 | 2,640 |
| 2015 | 2,582 | 2,587 | 2,806 | 2,524 | 2,836 | 2,930 | 2,589 | 2,708 | 2,404 | 2,382 | 2,695 | 2,592 |
| 2016 | 2,520 | 2,646 | 2,674 | 2,194 | 2,597 | 2,689 | 2,678 | 2,611 | 2,613 | 2,450 | 2,712 | 2,889 |
| 2017 | 2,876 | 2,658 | 2,747 | 2,634 | 2,841 | 2,835 | 2,877 | 2,697 | 2,650 | 2,518 | 2,956 | 2,930 |
| 2018 | 2,923 | 2,681 | 2,748 | 2,990 | 2,825 | 2,751 | 2,896 | 2,793 | 2,972 | 2,464 | 3,060 | 2,985 |
| 2019 | 2,989 | 2,428 | 2,998 | 2,664 | 2,279 | 2,221 | 2,572 | 2,544 | 2,598 | 2,337 | 2,476 | 2,473 |
| 2020 | 2,617 | 2,428 | 3,001 | 2,257 | 2,251 | 2,241 | 2,311 | 2,305 | 2,389 | 2,615 | 2,523 | 2,363 |
| 2021 | 2,992 | 3,204 | 2,952 | 2,485 | 2,718 | 3,061 | 2,824 | 2,815 | 3,298 | 2,836 | 2,754 | 3,166 |
| 2022 | 3,306 | 3,061 | 3,290 | 3,108 | 2,791 | 2,947 | 2,927 | 2,424 | 3,049 | 3,449 | 3,072 | 2,824 |
| 2023 | 3,280 | 2,977 | 3,115 | 3,086 | 3,037 | 2,934 | 3,202 | 2,837 | 3,208 | 2,956 | 3,073 | 3,141 |
| 2024 | 3,269 | |||||||||||
| - = No Data Reported; -- = Not Applicable; NA = Not Available; W = Withheld to avoid disclosure of individual company data. |
| Release Date: 3/29/2024 |
| Next Release Date: 4/30/2024 |