|
Download Data (XLS File) |
|
||||||||
|
||||||||
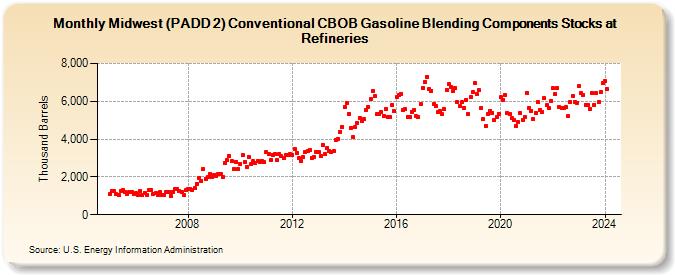
| Midwest (PADD 2) Conventional CBOB Gasoline Blending Components Stocks at Refineries (Thousand Barrels) | ||||||||
| Year | Jan | Feb | Mar | Apr | May | Jun | Jul | Aug | Sep | Oct | Nov | Dec |
|---|---|---|---|---|---|---|---|---|---|---|---|---|
| 2005 | 1,087 | 1,244 | 1,232 | 1,070 | 1,034 | 1,259 | 1,294 | 1,184 | 1,098 | 1,198 | 1,178 | 1,108 |
| 2006 | 1,123 | 1,029 | 1,243 | 1,021 | 1,169 | 1,058 | 1,295 | 1,295 | 1,088 | 1,143 | 1,061 | 1,195 |
| 2007 | 1,059 | 1,018 | 1,186 | 1,203 | 997 | 1,209 | 1,338 | 1,348 | 1,244 | 1,179 | 1,038 | 1,281 |
| 2008 | 1,385 | 1,380 | 1,312 | 1,414 | 1,633 | 1,962 | 1,789 | 2,419 | 1,907 | 1,977 | 2,176 | 2,000 |
| 2009 | 2,113 | 2,043 | 2,142 | 2,161 | 2,019 | 2,742 | 2,880 | 3,084 | 2,815 | 2,428 | 2,807 | 2,428 |
| 2010 | 2,679 | 3,136 | 2,786 | 2,525 | 3,066 | 2,662 | 2,825 | 2,762 | 2,838 | 2,794 | 2,848 | 2,771 |
| 2011 | 3,315 | 3,191 | 2,892 | 3,178 | 3,203 | 2,881 | 3,208 | 3,084 | 2,997 | 3,164 | 3,158 | 3,187 |
| 2012 | 3,159 | 3,457 | 3,291 | 2,980 | 2,864 | 3,042 | 3,298 | 3,362 | 3,446 | 3,017 | 3,044 | 3,337 |
| 2013 | 3,308 | 3,107 | 3,706 | 3,234 | 3,527 | 3,376 | 3,316 | 3,348 | 3,972 | 3,992 | 4,391 | 4,642 |
| 2014 | 5,692 | 5,928 | 5,353 | 4,599 | 4,093 | 4,645 | 4,856 | 5,142 | 4,957 | 5,047 | 5,557 | 5,705 |
| 2015 | 6,119 | 6,559 | 6,277 | 5,314 | 5,314 | 5,427 | 5,248 | 5,588 | 5,182 | 5,188 | 5,791 | 5,486 |
| 2016 | 6,234 | 6,312 | 6,388 | 5,524 | 5,574 | 5,186 | 5,175 | 5,436 | 5,530 | 5,196 | 5,168 | 5,852 |
| 2017 | 6,717 | 7,022 | 7,309 | 6,632 | 6,561 | 5,848 | 5,741 | 5,419 | 5,469 | 5,309 | 5,573 | 6,587 |
| 2018 | 6,899 | 6,766 | 6,525 | 6,711 | 5,974 | 5,735 | 5,948 | 5,661 | 6,088 | 5,336 | 6,232 | 6,486 |
| 2019 | 6,975 | 6,374 | 6,571 | 5,638 | 5,060 | 4,697 | 5,321 | 5,497 | 5,402 | 5,026 | 5,154 | 5,347 |
| 2020 | 6,205 | 6,082 | 6,337 | 5,380 | 5,330 | 5,091 | 5,020 | 4,686 | 4,913 | 5,380 | 5,031 | 5,157 |
| 2021 | 6,440 | 5,635 | 5,476 | 5,060 | 5,389 | 5,945 | 5,559 | 5,443 | 6,148 | 5,783 | 5,621 | 6,021 |
| 2022 | 6,700 | 6,389 | 6,685 | 5,697 | 5,657 | 5,639 | 5,682 | 5,205 | 5,988 | 6,293 | 5,976 | 5,929 |
| 2023 | 6,795 | 6,422 | 6,336 | 5,821 | 5,809 | 5,617 | 6,450 | 5,819 | 6,422 | 5,947 | 6,499 | 6,969 |
| 2024 | 7,072 | |||||||||||
| - = No Data Reported; -- = Not Applicable; NA = Not Available; W = Withheld to avoid disclosure of individual company data. |
| Release Date: 3/29/2024 |
| Next Release Date: 4/30/2024 |