|
Download Data (XLS File) |
|
||||||||
|
||||||||
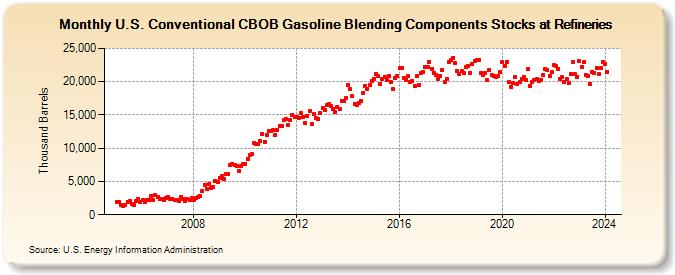
| U.S. Conventional CBOB Gasoline Blending Components Stocks at Refineries (Thousand Barrels) | ||||||||
| Year | Jan | Feb | Mar | Apr | May | Jun | Jul | Aug | Sep | Oct | Nov | Dec |
|---|---|---|---|---|---|---|---|---|---|---|---|---|
| 2005 | 1,917 | 1,964 | 1,528 | 1,250 | 1,486 | 1,951 | 2,041 | 1,661 | 1,492 | 2,085 | 2,397 | 1,879 |
| 2006 | 2,208 | 1,914 | 2,202 | 2,204 | 2,757 | 2,200 | 2,893 | 2,648 | 2,354 | 2,411 | 2,249 | 2,540 |
| 2007 | 2,696 | 2,311 | 2,425 | 2,216 | 2,160 | 2,077 | 2,607 | 2,414 | 2,106 | 2,395 | 2,246 | 2,550 |
| 2008 | 2,212 | 2,505 | 2,622 | 2,754 | 3,542 | 4,513 | 3,856 | 4,679 | 4,068 | 4,164 | 5,142 | 4,845 |
| 2009 | 5,591 | 5,811 | 5,352 | 6,112 | 6,166 | 7,509 | 7,608 | 7,433 | 7,367 | 6,594 | 7,255 | 7,609 |
| 2010 | 7,629 | 8,317 | 8,903 | 9,079 | 10,753 | 10,558 | 10,627 | 11,054 | 12,187 | 10,988 | 11,998 | 12,649 |
| 2011 | 12,510 | 12,684 | 12,047 | 12,758 | 13,372 | 13,326 | 14,187 | 14,324 | 13,425 | 14,234 | 15,060 | 14,748 |
| 2012 | 14,760 | 14,468 | 15,333 | 14,713 | 13,803 | 14,850 | 15,605 | 13,634 | 15,116 | 14,531 | 14,448 | 15,273 |
| 2013 | 16,081 | 15,695 | 16,517 | 16,623 | 16,359 | 15,916 | 15,386 | 16,207 | 15,826 | 17,167 | 17,086 | 17,550 |
| 2014 | 19,499 | 18,892 | 17,805 | 16,680 | 16,511 | 16,777 | 17,090 | 18,365 | 19,405 | 18,932 | 19,477 | 20,130 |
| 2015 | 20,369 | 21,146 | 20,793 | 19,694 | 20,379 | 20,703 | 20,261 | 20,871 | 19,909 | 18,969 | 20,602 | 20,832 |
| 2016 | 21,998 | 22,071 | 20,572 | 20,253 | 20,868 | 20,016 | 20,151 | 19,333 | 20,860 | 19,477 | 21,365 | 21,471 |
| 2017 | 22,162 | 22,218 | 22,922 | 21,939 | 21,270 | 21,047 | 20,465 | 20,822 | 21,734 | 19,995 | 20,363 | 23,012 |
| 2018 | 23,238 | 23,604 | 22,793 | 21,596 | 21,111 | 21,609 | 21,310 | 22,203 | 22,299 | 21,374 | 22,584 | 23,105 |
| 2019 | 23,227 | 23,202 | 21,283 | 20,985 | 21,312 | 20,200 | 21,785 | 21,058 | 20,835 | 20,679 | 20,802 | 21,424 |
| 2020 | 23,007 | 22,357 | 22,964 | 19,956 | 19,209 | 19,848 | 20,735 | 19,670 | 19,939 | 20,385 | 20,660 | 20,238 |
| 2021 | 21,874 | 19,344 | 19,996 | 20,290 | 20,362 | 20,060 | 20,295 | 20,970 | 21,871 | 21,742 | 20,842 | 21,403 |
| 2022 | 22,537 | 22,306 | 21,957 | 20,407 | 20,645 | 19,969 | 20,420 | 19,815 | 21,187 | 22,889 | 21,136 | 20,706 |
| 2023 | 23,083 | 22,213 | 22,902 | 21,038 | 20,807 | 19,716 | 21,457 | 21,266 | 22,093 | 21,129 | 22,050 | 22,990 |
| 2024 | 22,696 | |||||||||||
| - = No Data Reported; -- = Not Applicable; NA = Not Available; W = Withheld to avoid disclosure of individual company data. |
| Release Date: 3/29/2024 |
| Next Release Date: 4/30/2024 |