|
Download Data (XLS File) |
|
||||||||
|
||||||||
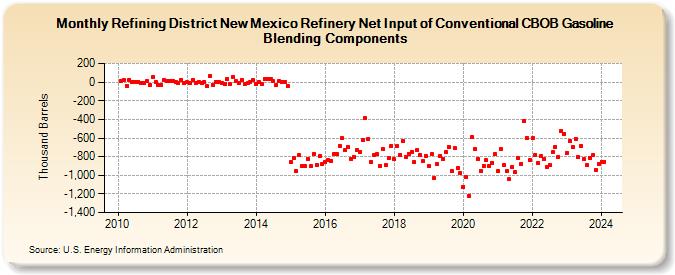
| Refining District New Mexico Refinery Net Input of Conventional CBOB Gasoline Blending Components (Thousand Barrels) | ||||||||
| Year | Jan | Feb | Mar | Apr | May | Jun | Jul | Aug | Sep | Oct | Nov | Dec |
|---|---|---|---|---|---|---|---|---|---|---|---|---|
| 2010 | 17 | 22 | -39 | 28 | 3 | 6 | 5 | -6 | -13 | 7 | -28 | |
| 2011 | 51 | -4 | -26 | -28 | 23 | 15 | 12 | 16 | -4 | -11 | 27 | -14 |
| 2012 | -1 | -13 | 27 | -9 | -1 | -11 | 6 | -47 | 64 | -27 | 5 | -2 |
| 2013 | -6 | -16 | 33 | -25 | 58 | 9 | -6 | 27 | -16 | -14 | 3 | 20 |
| 2014 | -21 | 3 | -20 | 31 | 38 | 34 | 7 | -29 | 10 | 3 | 5 | -41 |
| 2015 | -860 | -813 | -958 | -786 | -898 | -904 | -821 | -905 | -771 | -886 | -795 | -879 |
| 2016 | -859 | -831 | -847 | -772 | -773 | -684 | -600 | -733 | -699 | -826 | -801 | -728 |
| 2017 | -751 | -621 | -389 | -610 | -854 | -786 | -776 | -902 | -720 | -894 | -819 | -684 |
| 2018 | -830 | -691 | -777 | -633 | -800 | -769 | -752 | -855 | -728 | -777 | -848 | -792 |
| 2019 | -896 | -770 | -1,031 | -883 | -792 | -820 | -751 | -696 | -955 | -702 | -920 | -971 |
| 2020 | -1,125 | -1,020 | -1,220 | -591 | -719 | -827 | -954 | -896 | -839 | -898 | -863 | -773 |
| 2021 | -954 | -722 | -894 | -954 | -1,045 | -909 | -968 | -815 | -878 | -415 | -597 | -840 |
| 2022 | -600 | -777 | -870 | -798 | -823 | -907 | -892 | -753 | -693 | -802 | -527 | -555 |
| 2023 | -756 | -631 | -696 | -610 | -804 | -684 | -828 | -892 | -816 | -786 | -948 | -883 |
| 2024 | -854 | |||||||||||
| - = No Data Reported; -- = Not Applicable; NA = Not Available; W = Withheld to avoid disclosure of individual company data. |
| Release Date: 3/29/2024 |
| Next Release Date: 4/30/2024 |