|
Download Data (XLS File) |
|
||||||||
|
||||||||
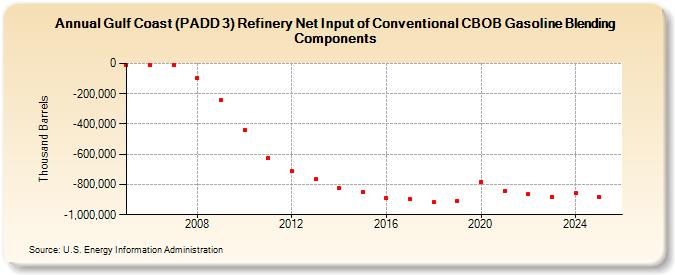
| Gulf Coast (PADD 3) Refinery Net Input of Conventional CBOB Gasoline Blending Components (Thousand Barrels) | ||||||||
| Decade | Year-0 | Year-1 | Year-2 | Year-3 | Year-4 | Year-5 | Year-6 | Year-7 | Year-8 | Year-9 |
|---|---|---|---|---|---|---|---|---|---|---|
| 2000's | -12,451 | -12,304 | -13,090 | -95,213 | -244,128 | |||||
| 2010's | -437,939 | -621,771 | -711,260 | -764,998 | -825,445 | -848,786 | -892,294 | -898,828 | -918,225 | -907,202 |
| 2020's | -783,106 | -842,418 | -865,252 | -880,364 |
| - = No Data Reported; -- = Not Applicable; NA = Not Available; W = Withheld to avoid disclosure of individual company data. |
| Release Date: 3/29/2024 |
| Next Release Date: 8/30/2024 |