|
Download Data (XLS File) |
|
||||||||
|
||||||||
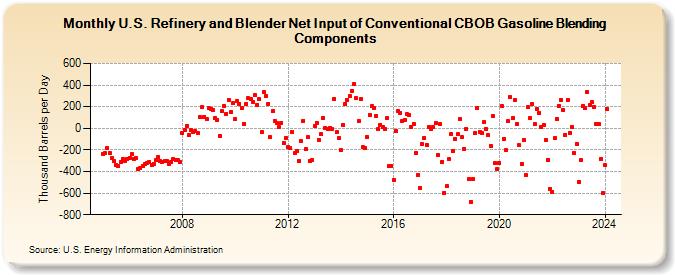
| U.S. Refinery and Blender Net Input of Conventional CBOB Gasoline Blending Components (Thousand Barrels per Day) | ||||||||
| Year | Jan | Feb | Mar | Apr | May | Jun | Jul | Aug | Sep | Oct | Nov | Dec |
|---|---|---|---|---|---|---|---|---|---|---|---|---|
| 2005 | -237 | -232 | -185 | -227 | -276 | -306 | -338 | -351 | -309 | -286 | -303 | -285 |
| 2006 | -272 | -242 | -281 | -279 | -377 | -369 | -347 | -332 | -320 | -313 | -340 | -326 |
| 2007 | -297 | -265 | -300 | -310 | -306 | -306 | -332 | -315 | -285 | -297 | -296 | -308 |
| 2008 | -41 | -15 | 19 | -64 | -15 | -34 | -24 | -43 | 104 | 194 | 108 | 83 |
| 2009 | 186 | 182 | 168 | 92 | 78 | -69 | 157 | 207 | 135 | 262 | 148 | 231 |
| 2010 | 82 | 251 | 225 | 187 | 44 | 225 | 278 | 275 | 245 | 304 | 220 | 271 |
| 2011 | -31 | 337 | 301 | 229 | -79 | 156 | 72 | 49 | 11 | 53 | -136 | -86 |
| 2012 | -171 | -187 | -38 | -229 | -211 | -299 | -118 | 72 | -196 | -85 | -299 | -295 |
| 2013 | 20 | 53 | -107 | -56 | 93 | 7 | -11 | 7 | -7 | 273 | -36 | -93 |
| 2014 | -202 | 32 | 228 | 260 | 300 | 349 | 414 | 280 | 67 | 271 | -177 | -187 |
| 2015 | -81 | 125 | 204 | 189 | 118 | -8 | 35 | 12 | -3 | 91 | -353 | -351 |
| 2016 | -478 | -24 | 162 | 143 | 70 | 76 | 130 | 121 | 8 | 37 | -226 | -433 |
| 2017 | -550 | -146 | -92 | -151 | 11 | -4 | 13 | 50 | -247 | 39 | -308 | -595 |
| 2018 | -535 | -285 | -54 | -207 | -99 | -56 | 83 | -83 | -188 | -5 | -472 | -679 |
| 2019 | -465 | -45 | 191 | -35 | -40 | 55 | -2 | -66 | -163 | 110 | -323 | -378 |
| 2020 | -321 | 202 | -96 | -204 | 63 | 289 | 95 | 262 | 38 | -157 | -326 | -106 |
| 2021 | -436 | 194 | 94 | 226 | 37 | 179 | 145 | 16 | 27 | -105 | -290 | -558 |
| 2022 | -587 | -94 | 90 | 209 | 262 | 171 | -58 | 265 | -42 | 13 | -227 | -144 |
| 2023 | -494 | -296 | 208 | 185 | 336 | 212 | 241 | 200 | 37 | 44 | -283 | -600 |
| 2024 | -343 | |||||||||||
| - = No Data Reported; -- = Not Applicable; NA = Not Available; W = Withheld to avoid disclosure of individual company data. |
| Release Date: 3/29/2024 |
| Next Release Date: 4/30/2024 |