|
Download Data (XLS File) |
|
||||||||
|
||||||||
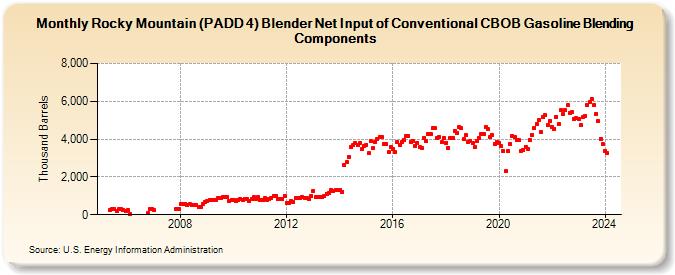
| Rocky Mountain (PADD 4) Blender Net Input of Conventional CBOB Gasoline Blending Components (Thousand Barrels) | ||||||||
| Year | Jan | Feb | Mar | Apr | May | Jun | Jul | Aug | Sep | Oct | Nov | Dec |
|---|---|---|---|---|---|---|---|---|---|---|---|---|
| 2005 | 224 | 315 | 299 | 180 | 288 | 296 | 268 | 175 | ||||
| 2006 | 243 | 14 | 75 | 277 | 294 | |||||||
| 2007 | 236 | 299 | 312 | |||||||||
| 2008 | 584 | 586 | 589 | 495 | 551 | 503 | 489 | 493 | 383 | 419 | 571 | 667 |
| 2009 | 738 | 777 | 782 | 758 | 764 | 863 | 903 | 914 | 920 | 941 | 728 | 791 |
| 2010 | 768 | 701 | 794 | 833 | 778 | 822 | 823 | 719 | 832 | 918 | 809 | 922 |
| 2011 | 770 | 778 | 873 | 790 | 839 | 902 | 1,003 | 1,005 | 821 | 836 | 856 | 1,000 |
| 2012 | 618 | 616 | 713 | 680 | 876 | 880 | 883 | 941 | 906 | 876 | 851 | 1,008 |
| 2013 | 1,263 | 926 | 915 | 927 | 923 | 1,002 | 1,109 | 1,173 | 1,297 | 1,279 | 1,319 | 1,314 |
| 2014 | 1,324 | 1,228 | 2,634 | 2,764 | 3,054 | 3,569 | 3,669 | 3,782 | 3,690 | 3,784 | 3,484 | 3,638 |
| 2015 | 3,707 | 3,240 | 3,879 | 3,516 | 3,871 | 4,010 | 4,106 | 4,133 | 3,739 | 3,735 | 3,296 | 3,570 |
| 2016 | 3,450 | 3,310 | 3,842 | 3,669 | 3,832 | 3,945 | 4,140 | 4,173 | 3,856 | 3,922 | 3,659 | 3,788 |
| 2017 | 3,565 | 3,535 | 4,078 | 3,906 | 4,259 | 4,282 | 4,585 | 4,565 | 4,039 | 4,113 | 3,828 | 4,061 |
| 2018 | 3,809 | 3,546 | 4,080 | 4,052 | 4,432 | 4,328 | 4,634 | 4,562 | 3,988 | 4,198 | 3,841 | 3,896 |
| 2019 | 3,769 | 3,564 | 3,891 | 4,050 | 4,272 | 4,246 | 4,641 | 4,530 | 4,093 | 4,196 | 3,741 | 3,865 |
| 2020 | 3,790 | 3,615 | 3,346 | 2,286 | 3,345 | 3,756 | 4,152 | 4,106 | 3,968 | 3,938 | 3,379 | 3,398 |
| 2021 | 3,599 | 3,496 | 3,978 | 4,241 | 4,605 | 4,790 | 4,998 | 4,350 | 5,158 | 5,249 | 4,752 | 4,951 |
| 2022 | 4,617 | 4,522 | 5,192 | 4,794 | 5,517 | 5,306 | 5,524 | 5,778 | 5,399 | 5,407 | 5,085 | 5,102 |
| 2023 | 5,084 | 4,729 | 5,173 | 5,235 | 5,779 | 5,949 | 6,104 | 5,806 | 5,331 | 4,946 | 4,029 | 3,717 |
| 2024 | 3,394 | |||||||||||
| - = No Data Reported; -- = Not Applicable; NA = Not Available; W = Withheld to avoid disclosure of individual company data. |
| Release Date: 3/29/2024 |
| Next Release Date: 4/30/2024 |