|
Download Data (XLS File) |
|
||||||||
|
||||||||
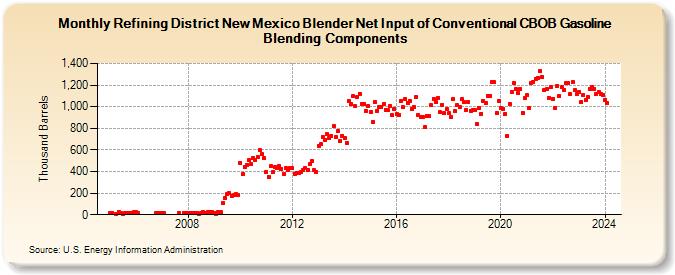
| Refining District New Mexico Blender Net Input of Conventional CBOB Gasoline Blending Components (Thousand Barrels) | ||||||||
| Year | Jan | Feb | Mar | Apr | May | Jun | Jul | Aug | Sep | Oct | Nov | Dec |
|---|---|---|---|---|---|---|---|---|---|---|---|---|
| 2005 | 19 | 19 | 9 | 29 | 16 | 7 | 17 | 17 | 18 | 20 | 23 | |
| 2006 | 21 | 18 | 12 | 16 | 14 | |||||||
| 2007 | 15 | 13 | 15 | 18 | 18 | |||||||
| 2008 | 16 | 16 | 17 | 17 | 17 | 4 | 18 | 22 | 19 | 22 | 23 | 21 |
| 2009 | 16 | 10 | 22 | 22 | 109 | 155 | 193 | 197 | 176 | 178 | 191 | 179 |
| 2010 | 482 | 376 | 445 | 460 | 505 | 465 | 527 | 508 | 535 | 600 | 561 | 523 |
| 2011 | 394 | 350 | 448 | 395 | 441 | 430 | 449 | 426 | 378 | 434 | 410 | 435 |
| 2012 | 430 | 381 | 388 | 385 | 393 | 417 | 430 | 414 | 465 | 494 | 411 | 399 |
| 2013 | 639 | 650 | 721 | 693 | 745 | 707 | 733 | 817 | 722 | 771 | 684 | 731 |
| 2014 | 712 | 666 | 1,050 | 1,024 | 1,096 | 1,004 | 1,094 | 1,122 | 1,029 | 1,024 | 959 | 1,006 |
| 2015 | 955 | 856 | 1,042 | 964 | 995 | 994 | 1,027 | 973 | 966 | 1,008 | 920 | 977 |
| 2016 | 932 | 926 | 1,052 | 996 | 1,069 | 1,036 | 1,056 | 983 | 996 | 1,092 | 919 | 905 |
| 2017 | 902 | 808 | 912 | 915 | 1,013 | 1,074 | 1,047 | 1,083 | 947 | 1,020 | 939 | 975 |
| 2018 | 939 | 906 | 1,067 | 957 | 1,013 | 997 | 1,072 | 1,042 | 971 | 1,045 | 963 | 966 |
| 2019 | 967 | 837 | 992 | 935 | 1,053 | 1,035 | 1,103 | 1,102 | 1,231 | 1,224 | 940 | 1,051 |
| 2020 | 984 | 981 | 931 | 730 | 1,025 | 1,138 | 1,216 | 1,160 | 1,127 | 1,164 | 944 | 1,082 |
| 2021 | 1,106 | 991 | 1,220 | 1,229 | 1,260 | 1,269 | 1,330 | 1,277 | 1,157 | 1,163 | 1,082 | 1,178 |
| 2022 | 1,075 | 988 | 1,195 | 1,098 | 1,178 | 1,158 | 1,219 | 1,221 | 1,114 | 1,224 | 1,152 | 1,121 |
| 2023 | 1,137 | 1,042 | 1,111 | 1,064 | 1,094 | 1,161 | 1,178 | 1,167 | 1,116 | 1,135 | 1,119 | 1,105 |
| 2024 | 1,062 | |||||||||||
| - = No Data Reported; -- = Not Applicable; NA = Not Available; W = Withheld to avoid disclosure of individual company data. |
| Release Date: 3/29/2024 |
| Next Release Date: 4/30/2024 |