|
Download Data (XLS File) |
|
||||||||
|
||||||||
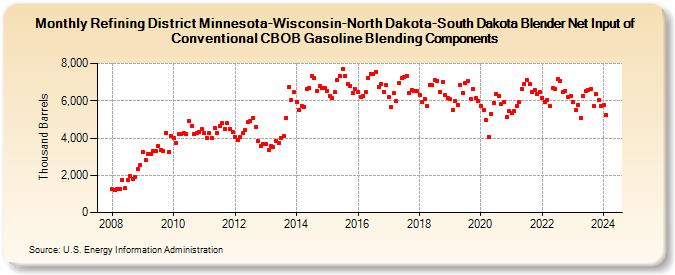
| Refining District Minnesota-Wisconsin-North Dakota-South Dakota Blender Net Input of Conventional CBOB Gasoline Blending Components (Thousand Barrels) | ||||||||
| Year | Jan | Feb | Mar | Apr | May | Jun | Jul | Aug | Sep | Oct | Nov | Dec |
|---|---|---|---|---|---|---|---|---|---|---|---|---|
| 2008 | 1,241 | 1,206 | 1,263 | 1,280 | 1,746 | 1,306 | 1,748 | 1,948 | 1,805 | 1,924 | 2,322 | 2,565 |
| 2009 | 3,238 | 2,844 | 3,136 | 3,158 | 3,321 | 3,286 | 3,579 | 3,333 | 3,295 | 4,290 | 3,242 | 4,125 |
| 2010 | 3,980 | 3,757 | 4,193 | 4,193 | 4,257 | 4,226 | 4,902 | 4,652 | 4,192 | 4,244 | 4,314 | 4,474 |
| 2011 | 4,258 | 3,975 | 4,256 | 4,014 | 4,529 | 4,279 | 4,660 | 4,785 | 4,462 | 4,782 | 4,489 | 4,302 |
| 2012 | 4,063 | 3,878 | 4,048 | 4,255 | 4,418 | 4,839 | 4,923 | 5,054 | 4,595 | 3,866 | 3,578 | 3,678 |
| 2013 | 3,659 | 3,381 | 3,575 | 3,502 | 3,848 | 3,735 | 4,022 | 4,091 | 5,092 | 6,724 | 6,033 | 6,470 |
| 2014 | 5,946 | 5,507 | 5,723 | 5,684 | 6,620 | 6,661 | 7,336 | 7,201 | 6,543 | 6,788 | 6,707 | 6,682 |
| 2015 | 6,535 | 6,248 | 6,134 | 6,451 | 7,096 | 7,315 | 7,694 | 7,353 | 6,919 | 6,779 | 6,439 | 6,609 |
| 2016 | 6,493 | 6,202 | 6,241 | 6,454 | 7,237 | 7,455 | 7,448 | 7,550 | 6,731 | 6,914 | 6,487 | 6,831 |
| 2017 | 6,182 | 5,640 | 6,398 | 5,982 | 6,954 | 7,217 | 7,275 | 7,343 | 6,417 | 6,578 | 6,527 | 6,498 |
| 2018 | 6,322 | 5,918 | 6,099 | 5,705 | 6,872 | 6,832 | 7,115 | 7,083 | 6,458 | 7,016 | 6,315 | 6,167 |
| 2019 | 6,071 | 5,523 | 5,990 | 5,797 | 6,853 | 6,430 | 6,976 | 7,073 | 6,088 | 6,646 | 6,122 | 6,000 |
| 2020 | 5,722 | 5,505 | 4,979 | 4,081 | 5,277 | 5,854 | 6,365 | 6,267 | 5,823 | 5,959 | 5,120 | 5,429 |
| 2021 | 5,356 | 5,459 | 5,734 | 5,928 | 6,646 | 6,890 | 7,131 | 6,890 | 6,470 | 6,594 | 6,360 | 6,469 |
| 2022 | 6,173 | 5,937 | 6,040 | 5,713 | 6,683 | 6,628 | 7,182 | 7,078 | 6,489 | 6,543 | 6,206 | 6,272 |
| 2023 | 5,937 | 5,498 | 5,792 | 5,086 | 6,259 | 6,521 | 6,582 | 6,626 | 5,726 | 6,343 | 6,037 | 5,723 |
| 2024 | 5,768 | |||||||||||
| - = No Data Reported; -- = Not Applicable; NA = Not Available; W = Withheld to avoid disclosure of individual company data. |
| Release Date: 3/29/2024 |
| Next Release Date: 4/30/2024 |