|
Download Data (XLS File) |
|
||||||||
|
||||||||
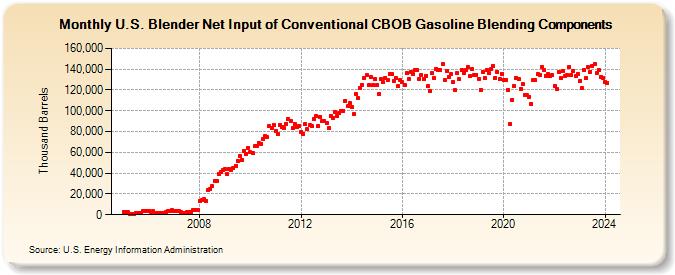
| U.S. Blender Net Input of Conventional CBOB Gasoline Blending Components (Thousand Barrels) | ||||||||
| Year | Jan | Feb | Mar | Apr | May | Jun | Jul | Aug | Sep | Oct | Nov | Dec |
|---|---|---|---|---|---|---|---|---|---|---|---|---|
| 2005 | 2,399 | 2,312 | 2,357 | 995 | 871 | 1,148 | 1,570 | 1,509 | 1,968 | 3,476 | 3,444 | 3,406 |
| 2006 | 3,418 | 2,903 | 3,112 | 1,820 | 1,577 | 1,645 | 1,613 | 1,659 | 2,156 | 3,600 | 3,739 | 4,197 |
| 2007 | 3,888 | 3,376 | 3,626 | 2,274 | 2,122 | 2,114 | 2,251 | 2,319 | 2,973 | 4,181 | 4,293 | 4,327 |
| 2008 | 13,199 | 13,692 | 14,753 | 13,609 | 23,866 | 24,455 | 27,344 | 32,362 | 32,212 | 39,069 | 40,851 | 42,660 |
| 2009 | 43,768 | 39,006 | 44,151 | 43,450 | 45,024 | 47,101 | 51,576 | 56,017 | 52,807 | 61,425 | 58,596 | 64,476 |
| 2010 | 60,218 | 59,044 | 65,840 | 65,891 | 68,765 | 68,303 | 72,972 | 75,859 | 74,397 | 85,041 | 83,307 | 86,126 |
| 2011 | 80,090 | 77,665 | 86,653 | 84,500 | 83,275 | 87,665 | 91,946 | 90,135 | 83,389 | 87,628 | 84,011 | 85,574 |
| 2012 | 79,623 | 78,115 | 87,161 | 82,145 | 85,904 | 84,941 | 92,201 | 94,603 | 85,422 | 94,012 | 89,700 | 89,967 |
| 2013 | 88,283 | 83,508 | 95,388 | 93,484 | 98,496 | 94,617 | 97,532 | 99,915 | 100,128 | 109,782 | 104,296 | 107,004 |
| 2014 | 103,744 | 96,905 | 116,292 | 112,090 | 121,485 | 124,919 | 131,996 | 134,108 | 124,451 | 132,472 | 124,392 | 130,393 |
| 2015 | 125,254 | 115,970 | 130,241 | 127,422 | 131,842 | 129,545 | 135,724 | 135,054 | 128,662 | 131,392 | 123,571 | 129,566 |
| 2016 | 127,305 | 124,705 | 135,965 | 130,286 | 137,765 | 135,279 | 139,647 | 139,068 | 130,977 | 134,320 | 130,149 | 133,626 |
| 2017 | 123,533 | 118,960 | 136,125 | 131,668 | 140,179 | 138,814 | 139,689 | 144,575 | 129,414 | 138,506 | 132,772 | 135,074 |
| 2018 | 127,214 | 119,543 | 136,299 | 130,184 | 139,263 | 136,605 | 139,185 | 141,788 | 133,387 | 139,890 | 133,922 | 134,713 |
| 2019 | 130,569 | 120,214 | 137,025 | 131,617 | 139,224 | 136,187 | 139,850 | 143,518 | 131,828 | 137,621 | 130,495 | 135,627 |
| 2020 | 129,448 | 129,513 | 119,803 | 87,217 | 110,623 | 123,727 | 131,832 | 130,521 | 120,996 | 125,349 | 115,510 | 114,866 |
| 2021 | 113,513 | 106,887 | 129,653 | 129,122 | 135,191 | 134,347 | 142,567 | 139,300 | 133,750 | 135,093 | 132,977 | 134,421 |
| 2022 | 124,017 | 120,750 | 137,040 | 131,675 | 138,352 | 133,622 | 133,936 | 142,318 | 134,522 | 138,086 | 133,405 | 135,456 |
| 2023 | 128,543 | 121,433 | 139,384 | 131,263 | 142,196 | 137,532 | 143,040 | 144,648 | 135,967 | 139,176 | 132,836 | 131,666 |
| 2024 | 127,912 | |||||||||||
| - = No Data Reported; -- = Not Applicable; NA = Not Available; W = Withheld to avoid disclosure of individual company data. |
| Release Date: 3/29/2024 |
| Next Release Date: 4/30/2024 |