|
Download Data (XLS File) |
|
||||||||
|
||||||||
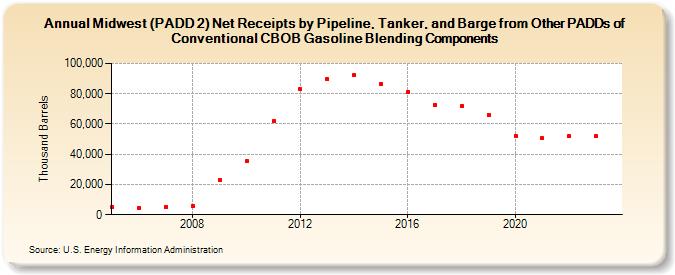
| Midwest (PADD 2) Net Receipts by Pipeline, Tanker, and Barge from Other PADDs of Conventional CBOB Gasoline Blending Components (Thousand Barrels) | ||||||||
| Decade | Year-0 | Year-1 | Year-2 | Year-3 | Year-4 | Year-5 | Year-6 | Year-7 | Year-8 | Year-9 |
|---|---|---|---|---|---|---|---|---|---|---|
| 2000's | 4,951 | 4,753 | 5,390 | 5,920 | 23,214 | |||||
| 2010's | 35,264 | 62,103 | 82,978 | 89,573 | 92,141 | 86,716 | 81,168 | 72,778 | 72,214 | 66,208 |
| 2020's | 52,094 | 50,444 | 51,800 | 51,776 |
| - = No Data Reported; -- = Not Applicable; NA = Not Available; W = Withheld to avoid disclosure of individual company data. |
| Release Date: 8/30/2024 |
| Next Release Date: 8/29/2025 |
Referring Pages: