|
Download Data (XLS File) |
|
||||||||
|
||||||||
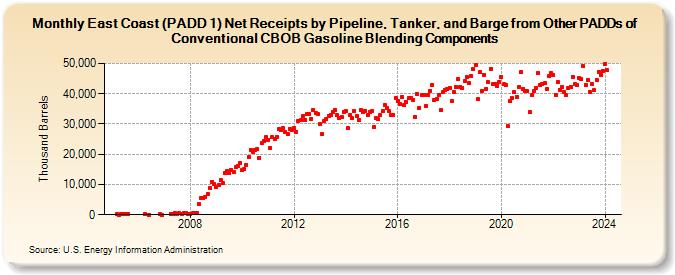
| East Coast (PADD 1) Net Receipts by Pipeline, Tanker, and Barge from Other PADDs of Conventional CBOB Gasoline Blending Components (Thousand Barrels) | ||||||||
| Year | Jan | Feb | Mar | Apr | May | Jun | Jul | Aug | Sep | Oct | Nov | Dec |
|---|---|---|---|---|---|---|---|---|---|---|---|---|
| 2005 | 74 | 50 | 134 | 130 | 326 | 206 | ||||||
| 2006 | 301 | 50 | 99 | 30 | ||||||||
| 2007 | 348 | 359 | 419 | 299 | 465 | 305 | 444 | 413 | 363 | |||
| 2008 | 396 | 406 | 524 | 617 | 3,438 | 5,433 | 5,614 | 5,929 | 6,990 | 8,792 | 10,899 | 10,077 |
| 2009 | 9,040 | 9,772 | 11,579 | 10,373 | 13,730 | 14,395 | 13,753 | 14,935 | 14,046 | 15,678 | 16,249 | 17,029 |
| 2010 | 14,721 | 15,114 | 16,465 | 18,957 | 21,438 | 20,674 | 21,351 | 21,807 | 18,764 | 23,724 | 24,488 | 25,594 |
| 2011 | 24,785 | 22,125 | 25,537 | 25,105 | 25,712 | 28,253 | 27,891 | 28,504 | 27,267 | 26,756 | 28,491 | 28,002 |
| 2012 | 28,590 | 27,377 | 31,061 | 31,239 | 32,585 | 31,371 | 33,230 | 33,225 | 31,776 | 34,563 | 33,690 | 33,266 |
| 2013 | 30,141 | 26,816 | 31,000 | 31,495 | 32,653 | 33,035 | 33,907 | 34,598 | 32,953 | 32,007 | 32,303 | 34,067 |
| 2014 | 34,142 | 28,605 | 32,919 | 31,822 | 34,300 | 32,584 | 31,353 | 34,640 | 33,891 | 34,448 | 32,938 | 33,906 |
| 2015 | 34,177 | 29,031 | 32,081 | 31,488 | 32,880 | 34,226 | 36,328 | 35,399 | 34,145 | 32,835 | 33,028 | 38,513 |
| 2016 | 37,754 | 36,623 | 39,073 | 36,279 | 37,329 | 38,492 | 38,665 | 38,011 | 32,149 | 40,068 | 35,376 | 39,734 |
| 2017 | 39,482 | 35,977 | 39,663 | 41,056 | 43,033 | 37,788 | 38,264 | 39,525 | 34,537 | 40,421 | 41,184 | 41,715 |
| 2018 | 41,909 | 37,456 | 40,638 | 42,125 | 44,860 | 42,360 | 41,924 | 44,281 | 45,453 | 43,491 | 45,826 | 48,229 |
| 2019 | 49,355 | 38,249 | 47,126 | 40,924 | 46,281 | 41,597 | 43,876 | 48,283 | 43,116 | 43,359 | 42,568 | 43,979 |
| 2020 | 45,585 | 43,188 | 42,916 | 29,195 | 37,494 | 38,463 | 40,506 | 38,973 | 42,160 | 47,087 | 41,654 | 41,040 |
| 2021 | 40,738 | 33,903 | 39,581 | 40,842 | 41,814 | 46,856 | 42,814 | 43,189 | 43,452 | 41,703 | 45,700 | 46,838 |
| 2022 | 46,061 | 39,644 | 43,851 | 41,368 | 42,094 | 40,522 | 39,422 | 41,902 | 42,257 | 45,544 | 43,079 | 42,860 |
| 2023 | 45,363 | 44,705 | 49,159 | 43,038 | 44,496 | 40,540 | 43,363 | 41,128 | 44,667 | 47,284 | 46,161 | 47,662 |
| 2024 | 49,777 | |||||||||||
| - = No Data Reported; -- = Not Applicable; NA = Not Available; W = Withheld to avoid disclosure of individual company data. |
| Release Date: 3/29/2024 |
| Next Release Date: 4/30/2024 |
Referring Pages: