|
Download Data (XLS File) |
|
||||||||
|
||||||||
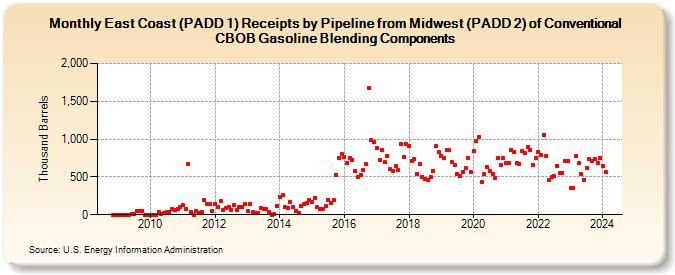
| East Coast (PADD 1) Receipts by Pipeline from Midwest (PADD 2) of Conventional CBOB Gasoline Blending Components (Thousand Barrels) | ||||||||
| Year | Jan | Feb | Mar | Apr | May | Jun | Jul | Aug | Sep | Oct | Nov | Dec |
|---|---|---|---|---|---|---|---|---|---|---|---|---|
| 2008 | 0 | 0 | ||||||||||
| 2009 | 0 | 0 | 0 | 0 | 0 | 12 | 4 | 54 | 51 | 53 | 0 | 0 |
| 2010 | 0 | 0 | 0 | 41 | 9 | 23 | 36 | 39 | 75 | 65 | 76 | 96 |
| 2011 | 127 | 70 | 669 | 33 | 0 | 51 | 28 | 40 | 193 | 140 | 145 | 55 |
| 2012 | 140 | 101 | 175 | 58 | 89 | 105 | 66 | 124 | 56 | 97 | 96 | 139 |
| 2013 | 48 | 136 | 35 | 25 | 20 | 91 | 81 | 70 | 40 | 0 | 3 | 113 |
| 2014 | 234 | 265 | 97 | 91 | 169 | 101 | 48 | 24 | 118 | 140 | 153 | 194 |
| 2015 | 164 | 220 | 98 | 80 | 78 | 109 | 201 | 153 | 190 | 528 | 751 | 806 |
| 2016 | 765 | 678 | 746 | 730 | 574 | 501 | 531 | 594 | 669 | 1,674 | 983 | 968 |
| 2017 | 887 | 730 | 858 | 695 | 781 | 603 | 581 | 643 | 588 | 929 | 769 | 937 |
| 2018 | 914 | 708 | 734 | 545 | 671 | 504 | 478 | 465 | 497 | 582 | 909 | 824 |
| 2019 | 778 | 753 | 853 | 852 | 691 | 657 | 540 | 510 | 565 | 621 | 748 | 568 |
| 2020 | 836 | 973 | 1,025 | 432 | 541 | 631 | 579 | 540 | 486 | 755 | 657 | 747 |
| 2021 | 680 | 687 | 859 | 823 | 686 | 676 | 841 | 816 | 897 | 856 | 651 | 748 |
| 2022 | 823 | 784 | 1,051 | 780 | 460 | 504 | 508 | 650 | 550 | 546 | 707 | 711 |
| 2023 | 357 | 352 | 779 | 683 | 533 | 464 | 624 | 736 | 704 | 739 | 688 | 744 |
| 2024 | 643 | |||||||||||
| - = No Data Reported; -- = Not Applicable; NA = Not Available; W = Withheld to avoid disclosure of individual company data. |
| Release Date: 3/29/2024 |
| Next Release Date: 4/30/2024 |