|
Download Data (XLS File) |
|
||||||||
|
||||||||
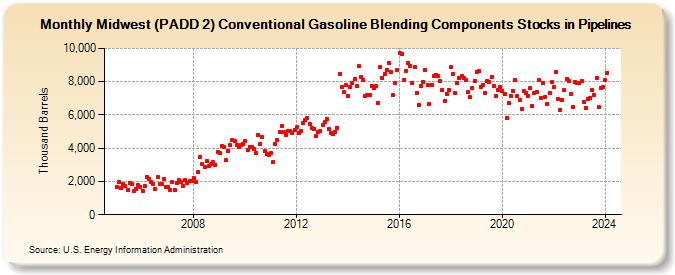
| Midwest (PADD 2) Conventional Gasoline Blending Components Stocks in Pipelines (Thousand Barrels) | ||||||||
| Year | Jan | Feb | Mar | Apr | May | Jun | Jul | Aug | Sep | Oct | Nov | Dec |
|---|---|---|---|---|---|---|---|---|---|---|---|---|
| 2005 | 1,684 | 1,938 | 1,605 | 1,829 | 1,721 | 1,458 | 1,931 | 1,829 | 1,432 | 1,564 | 1,786 | 1,687 |
| 2006 | 1,449 | 1,754 | 2,239 | 2,158 | 1,946 | 1,823 | 1,552 | 2,254 | 1,842 | 1,847 | 2,166 | 1,659 |
| 2007 | 1,679 | 1,471 | 1,945 | 1,507 | 1,901 | 2,116 | 1,959 | 1,704 | 2,094 | 1,884 | 2,010 | 2,031 |
| 2008 | 2,210 | 1,949 | 2,564 | 3,469 | 3,026 | 2,865 | 3,243 | 2,941 | 3,045 | 3,159 | 2,992 | 3,797 |
| 2009 | 3,703 | 4,120 | 4,073 | 3,272 | 3,849 | 4,164 | 4,496 | 4,426 | 4,219 | 4,092 | 4,204 | 4,278 |
| 2010 | 4,428 | 3,905 | 4,085 | 4,060 | 3,963 | 3,705 | 4,822 | 4,266 | 4,660 | 3,826 | 3,672 | 3,594 |
| 2011 | 3,686 | 3,179 | 4,226 | 4,484 | 4,965 | 5,361 | 4,988 | 4,798 | 5,047 | 5,020 | 4,900 | 5,100 |
| 2012 | 5,253 | 4,925 | 5,035 | 5,523 | 5,668 | 5,802 | 5,480 | 5,199 | 5,165 | 4,743 | 4,992 | 5,033 |
| 2013 | 5,397 | 5,604 | 5,755 | 5,158 | 4,901 | 4,834 | 4,991 | 5,222 | 8,487 | 7,668 | 7,397 | 7,780 |
| 2014 | 7,167 | 7,683 | 7,922 | 8,158 | 7,718 | 8,920 | 8,295 | 8,086 | 7,155 | 7,197 | 7,199 | 7,756 |
| 2015 | 7,615 | 7,717 | 6,745 | 8,864 | 8,239 | 8,455 | 8,696 | 9,118 | 8,574 | 7,190 | 7,890 | 8,689 |
| 2016 | 9,730 | 9,643 | 8,121 | 8,651 | 9,127 | 8,959 | 7,917 | 8,883 | 7,305 | 6,619 | 7,745 | 7,995 |
| 2017 | 8,676 | 7,820 | 6,647 | 7,792 | 8,335 | 8,426 | 8,322 | 8,042 | 7,504 | 6,836 | 7,269 | 7,499 |
| 2018 | 8,880 | 8,468 | 7,304 | 7,921 | 8,228 | 8,324 | 8,209 | 8,107 | 7,384 | 7,049 | 7,621 | 8,058 |
| 2019 | 8,604 | 8,615 | 7,702 | 7,807 | 7,296 | 8,017 | 7,999 | 8,285 | 7,767 | 7,137 | 7,507 | 7,660 |
| 2020 | 7,425 | 7,241 | 5,814 | 6,715 | 7,149 | 7,432 | 8,109 | 7,139 | 6,906 | 6,349 | 7,428 | 7,320 |
| 2021 | 7,151 | 7,591 | 6,508 | 7,334 | 7,390 | 8,085 | 7,027 | 7,927 | 7,084 | 6,675 | 7,310 | 7,962 |
| 2022 | 7,666 | 8,604 | 6,967 | 6,324 | 6,912 | 7,488 | 8,148 | 8,011 | 7,232 | 6,447 | 7,994 | 7,911 |
| 2023 | 7,891 | 8,040 | 6,806 | 6,438 | 6,980 | 7,025 | 7,503 | 7,194 | 8,241 | 6,449 | 7,604 | 7,666 |
| 2024 | 8,073 | |||||||||||
| - = No Data Reported; -- = Not Applicable; NA = Not Available; W = Withheld to avoid disclosure of individual company data. |
| Release Date: 3/29/2024 |
| Next Release Date: 4/30/2024 |