|
Download Data (XLS File) |
|
||||||||
|
||||||||
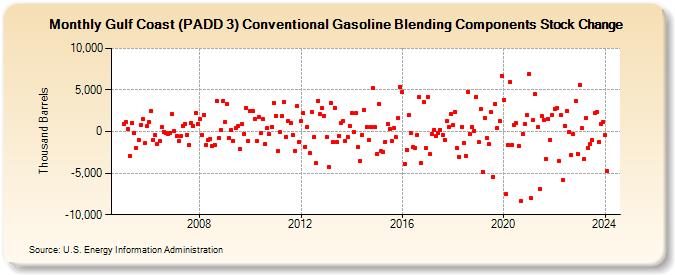
| Gulf Coast (PADD 3) Conventional Gasoline Blending Components Stock Change (Thousand Barrels) | ||||||||
| Year | Jan | Feb | Mar | Apr | May | Jun | Jul | Aug | Sep | Oct | Nov | Dec |
|---|---|---|---|---|---|---|---|---|---|---|---|---|
| 2005 | 883 | 1,152 | 349 | -2,907 | 1,051 | -221 | -1,937 | -1,014 | 769 | 1,509 | -1,408 | 669 |
| 2006 | 1,167 | 2,489 | -977 | -442 | -1,446 | -1,143 | 514 | -78 | -219 | -242 | -142 | 2,079 |
| 2007 | 44 | -529 | -1,118 | -593 | 712 | 947 | -385 | -1,666 | 1,056 | 657 | 2,218 | 849 |
| 2008 | 1,469 | -377 | 1,966 | -1,562 | -1,070 | -883 | -1,777 | -1,569 | 3,634 | -810 | 165 | 3,675 |
| 2009 | 1,157 | 3,299 | -833 | 215 | -1,111 | 401 | 632 | -2,106 | 854 | -257 | 2,839 | -1,132 |
| 2010 | 2,422 | 2,414 | 1,562 | -1,109 | 1,808 | -216 | 1,462 | -1,480 | 431 | -323 | 555 | 3,453 |
| 2011 | 1,899 | -2,349 | -72 | 1,863 | 3,594 | -637 | 1,276 | 989 | -386 | -2,317 | 3,021 | -1,252 |
| 2012 | 1,230 | 2,259 | -1,822 | 576 | -2,613 | 2,384 | -667 | -3,822 | 3,731 | 2,056 | 2,849 | 1,852 |
| 2013 | -638 | -4,260 | 3,414 | -1,272 | 2,819 | -1,200 | -561 | 976 | 1,247 | -1,146 | -615 | 697 |
| 2014 | 2,211 | -5 | 2,180 | -1,869 | -3,491 | -379 | 2,610 | 600 | -1,043 | 538 | 5,221 | 525 |
| 2015 | -2,672 | 3,336 | -2,352 | -2,434 | -1,240 | 906 | 312 | -1,114 | 436 | -710 | 1,579 | 5,399 |
| 2016 | 4,790 | -3,848 | -2,163 | 1,991 | -224 | -1,898 | -1,948 | -403 | 4,148 | -3,759 | 3,569 | -1,930 |
| 2017 | 4,211 | -2,758 | -267 | 207 | -583 | -204 | 244 | -430 | -1,001 | 1,213 | 571 | 2,103 |
| 2018 | 781 | 2,376 | -2,021 | -3,087 | 579 | -1,412 | -2,915 | 4,772 | -309 | 506 | 87 | 4,196 |
| 2019 | -1,303 | 2,697 | -4,808 | 1,615 | -746 | -1,507 | 2,314 | -5,405 | 3,330 | 409 | 1,298 | 6,719 |
| 2020 | 3,830 | -7,511 | -1,647 | 5,985 | -1,610 | 781 | 985 | -1,710 | -8,370 | -345 | 924 | 2,006 |
| 2021 | 6,902 | -8,030 | 1,349 | 4,461 | 493 | -6,889 | 1,831 | 1,374 | -3,284 | 1,549 | -985 | 1,986 |
| 2022 | 2,692 | 2,833 | -3,528 | 1,992 | -5,874 | 689 | 2,500 | -13 | -2,812 | -312 | 3,677 | -2,665 |
| 2023 | 5,648 | 373 | -3,331 | 1,648 | -2,031 | -1,462 | -1,022 | 2,254 | 2,370 | -1,224 | 923 | 1,188 |
| 2024 | -470 | |||||||||||
| - = No Data Reported; -- = Not Applicable; NA = Not Available; W = Withheld to avoid disclosure of individual company data. |
| Release Date: 3/29/2024 |
| Next Release Date: 4/30/2024 |