|
Download Data (XLS File) |
|
||||||||
|
||||||||
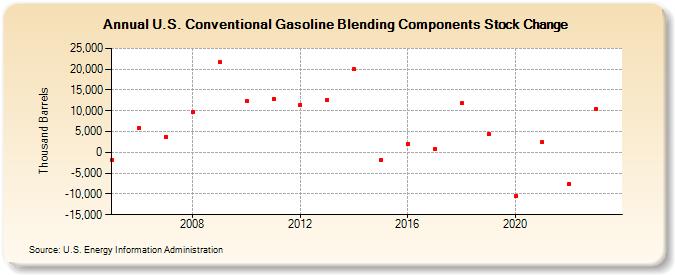
| U.S. Conventional Gasoline Blending Components Stock Change (Thousand Barrels) | ||||||||
| Decade | Year-0 | Year-1 | Year-2 | Year-3 | Year-4 | Year-5 | Year-6 | Year-7 | Year-8 | Year-9 |
|---|---|---|---|---|---|---|---|---|---|---|
| 2000's | -1,738 | 5,914 | 3,752 | 9,641 | 21,639 | |||||
| 2010's | 12,314 | 12,867 | 11,471 | 12,617 | 19,958 | -1,792 | 2,048 | 790 | 11,784 | 4,375 |
| 2020's | -10,452 | 2,453 | -7,606 | 12,558 |
| - = No Data Reported; -- = Not Applicable; NA = Not Available; W = Withheld to avoid disclosure of individual company data. |
| Release Date: 8/30/2024 |
| Next Release Date: 8/29/2025 |