|
Download Data (XLS File) |
|
||||||||
|
||||||||
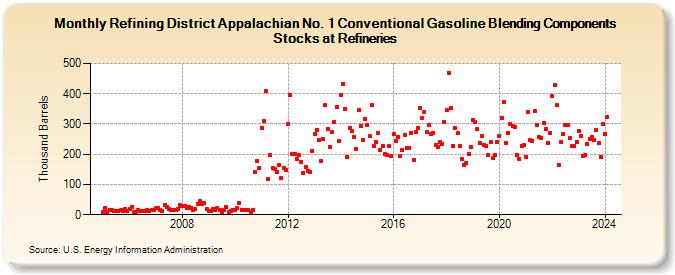
| Refining District Appalachian No. 1 Conventional Gasoline Blending Components Stocks at Refineries (Thousand Barrels) | ||||||||
| Year | Jan | Feb | Mar | Apr | May | Jun | Jul | Aug | Sep | Oct | Nov | Dec |
|---|---|---|---|---|---|---|---|---|---|---|---|---|
| 2005 | 9 | 23 | 10 | 17 | 15 | 11 | 13 | 11 | 14 | 11 | 20 | 12 |
| 2006 | 19 | 24 | 9 | 9 | 14 | 12 | 12 | 13 | 14 | 12 | 15 | 16 |
| 2007 | 23 | 23 | 17 | 11 | 32 | 27 | 18 | 16 | 17 | 14 | 20 | 31 |
| 2008 | 28 | 28 | 21 | 24 | 22 | 14 | 20 | 35 | 44 | 34 | 38 | 18 |
| 2009 | 13 | 13 | 20 | 16 | 21 | 15 | 10 | 14 | 25 | 10 | 12 | 15 |
| 2010 | 15 | 21 | 38 | 17 | 17 | 15 | 14 | 10 | 16 | 140 | 179 | 155 |
| 2011 | 287 | 310 | 409 | 118 | 196 | 154 | 151 | 141 | 164 | 120 | 156 | 149 |
| 2012 | 300 | 396 | 201 | 200 | 184 | 196 | 173 | 139 | 159 | 146 | 140 | 211 |
| 2013 | 268 | 281 | 246 | 177 | 249 | 363 | 285 | 224 | 275 | 308 | 357 | 243 |
| 2014 | 396 | 433 | 351 | 192 | 287 | 277 | 257 | 216 | 345 | 293 | 248 | 317 |
| 2015 | 295 | 261 | 363 | 226 | 240 | 270 | 214 | 227 | 201 | 197 | 227 | 195 |
| 2016 | 266 | 243 | 258 | 194 | 214 | 263 | 221 | 221 | 269 | 182 | 273 | 287 |
| 2017 | 352 | 319 | 340 | 272 | 295 | 266 | 271 | 230 | 224 | 241 | 235 | 305 |
| 2018 | 346 | 470 | 352 | 228 | 287 | 269 | 226 | 185 | 165 | 172 | 202 | 224 |
| 2019 | 314 | 308 | 284 | 238 | 260 | 230 | 227 | 196 | 241 | 187 | 197 | 242 |
| 2020 | 261 | 321 | 372 | 236 | 270 | 300 | 293 | 289 | 199 | 185 | 227 | 231 |
| 2021 | 191 | 339 | 247 | 243 | 343 | 297 | 258 | 252 | 304 | 282 | 237 | 269 |
| 2022 | 391 | 428 | 362 | 166 | 239 | 267 | 295 | 296 | 255 | 228 | 228 | 242 |
| 2023 | 276 | 261 | 195 | 199 | 234 | 250 | 256 | 247 | 280 | 236 | 192 | 299 |
| 2024 | 267 | |||||||||||
| - = No Data Reported; -- = Not Applicable; NA = Not Available; W = Withheld to avoid disclosure of individual company data. |
| Release Date: 3/29/2024 |
| Next Release Date: 4/30/2024 |