|
Download Data (XLS File) |
|
||||||||
|
||||||||
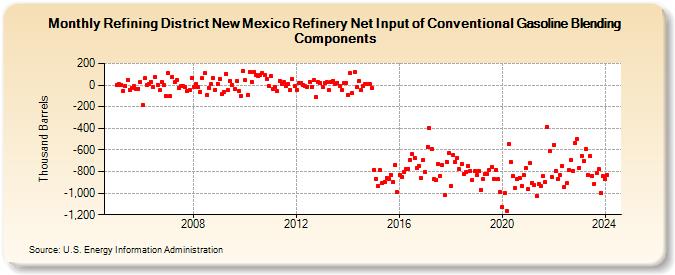
| Refining District New Mexico Refinery Net Input of Conventional Gasoline Blending Components (Thousand Barrels) | ||||||||
| Year | Jan | Feb | Mar | Apr | May | Jun | Jul | Aug | Sep | Oct | Nov | Dec |
|---|---|---|---|---|---|---|---|---|---|---|---|---|
| 2005 | -1 | 10 | 3 | -52 | -11 | 48 | -41 | -25 | -13 | -35 | -33 | 24 |
| 2006 | -184 | 63 | 4 | 10 | 31 | -16 | 73 | 3 | -50 | 31 | -2 | -104 |
| 2007 | 110 | -105 | 74 | 24 | 43 | -25 | -11 | -9 | -21 | -59 | -41 | 64 |
| 2008 | -18 | 14 | -18 | -60 | 65 | 110 | -95 | -25 | 6 | 63 | -43 | 13 |
| 2009 | 56 | -87 | -60 | 107 | -46 | 36 | -1 | -40 | 35 | -54 | -98 | 131 |
| 2010 | 43 | -96 | 124 | 29 | 121 | 94 | 84 | 93 | 114 | 94 | 57 | -6 |
| 2011 | 80 | -32 | -21 | -57 | 42 | 10 | 25 | -12 | 7 | -46 | 58 | -10 |
| 2012 | -46 | 17 | 20 | 0 | -11 | -14 | 33 | -19 | 47 | -112 | 25 | 18 |
| 2013 | -17 | 19 | 30 | -48 | 29 | 42 | 12 | 22 | -4 | -41 | 15 | 23 |
| 2014 | -89 | 108 | -75 | 117 | -19 | 34 | -50 | -9 | 9 | 12 | 12 | -23 |
| 2015 | -783 | -865 | -932 | -790 | -906 | -894 | -859 | -869 | -828 | -894 | -741 | -992 |
| 2016 | -830 | -851 | -804 | -777 | -774 | -689 | -642 | -671 | -769 | -749 | -861 | -689 |
| 2017 | -806 | -570 | -400 | -590 | -871 | -876 | -729 | -839 | -741 | -1,022 | -708 | -631 |
| 2018 | -935 | -647 | -708 | -675 | -780 | -731 | -825 | -808 | -751 | -791 | -877 | -799 |
| 2019 | -834 | -792 | -968 | -868 | -821 | -822 | -787 | -758 | -865 | -782 | -873 | -992 |
| 2020 | -1,127 | -1,003 | -1,165 | -550 | -713 | -842 | -949 | -869 | -857 | -934 | -831 | -770 |
| 2021 | -965 | -725 | -904 | -925 | -1,029 | -916 | -938 | -844 | -901 | -389 | -613 | -852 |
| 2022 | -552 | -794 | -866 | -835 | -751 | -944 | -909 | -784 | -689 | -793 | -536 | -501 |
| 2023 | -764 | -656 | -699 | -595 | -829 | -658 | -839 | -913 | -812 | -778 | -997 | -844 |
| 2024 | -873 | |||||||||||
| - = No Data Reported; -- = Not Applicable; NA = Not Available; W = Withheld to avoid disclosure of individual company data. |
| Release Date: 3/29/2024 |
| Next Release Date: 4/30/2024 |