|
Download Data (XLS File) |
|
||||||||
|
||||||||
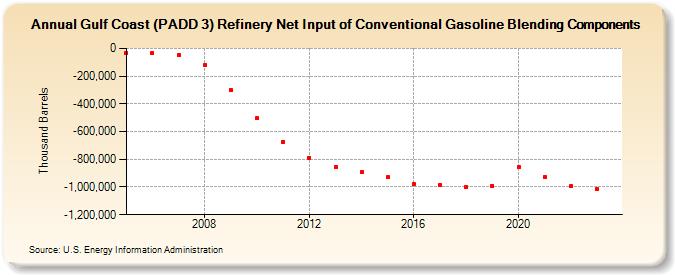
| Gulf Coast (PADD 3) Refinery Net Input of Conventional Gasoline Blending Components (Thousand Barrels) | ||||||||
| Decade | Year-0 | Year-1 | Year-2 | Year-3 | Year-4 | Year-5 | Year-6 | Year-7 | Year-8 | Year-9 |
|---|---|---|---|---|---|---|---|---|---|---|
| 2000's | -29,925 | -32,104 | -48,467 | -120,585 | -300,326 | |||||
| 2010's | -505,780 | -675,049 | -788,227 | -857,178 | -892,736 | -931,359 | -978,396 | -982,888 | -1,003,181 | -991,660 |
| 2020's | -856,454 | -927,667 | -995,946 | -1,014,980 |
| - = No Data Reported; -- = Not Applicable; NA = Not Available; W = Withheld to avoid disclosure of individual company data. |
| Release Date: 3/29/2024 |
| Next Release Date: 8/30/2024 |