|
Download Data (XLS File) |
|
||||||||
|
||||||||
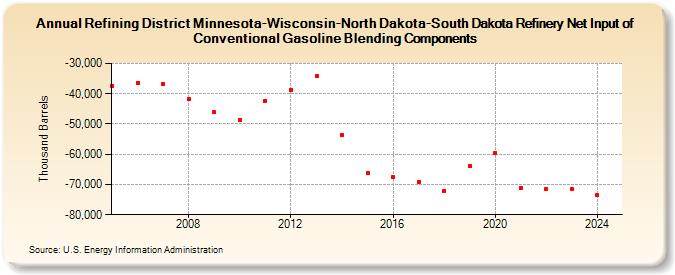
| Refining District Minnesota-Wisconsin-North Dakota-South Dakota Refinery Net Input of Conventional Gasoline Blending Components (Thousand Barrels) | ||||||||
| Decade | Year-0 | Year-1 | Year-2 | Year-3 | Year-4 | Year-5 | Year-6 | Year-7 | Year-8 | Year-9 |
|---|---|---|---|---|---|---|---|---|---|---|
| 2000's | -37,293 | -36,423 | -36,945 | -41,902 | -46,202 | |||||
| 2010's | -48,849 | -42,290 | -38,678 | -34,297 | -53,537 | -66,076 | -67,579 | -69,076 | -72,156 | -63,971 |
| 2020's | -59,471 | -71,064 | -71,562 | -71,426 |
| - = No Data Reported; -- = Not Applicable; NA = Not Available; W = Withheld to avoid disclosure of individual company data. |
| Release Date: 8/30/2024 |
| Next Release Date: 8/29/2025 |