|
Download Data (XLS File) |
|
||||||||
|
||||||||
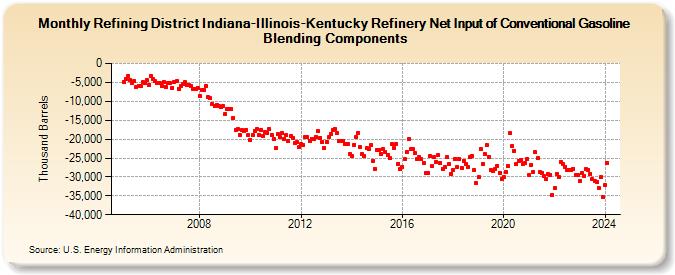
| Refining District Indiana-Illinois-Kentucky Refinery Net Input of Conventional Gasoline Blending Components (Thousand Barrels) | ||||||||
| Year | Jan | Feb | Mar | Apr | May | Jun | Jul | Aug | Sep | Oct | Nov | Dec |
|---|---|---|---|---|---|---|---|---|---|---|---|---|
| 2005 | -4,806 | -4,132 | -3,249 | -4,345 | -5,048 | -4,699 | -6,140 | -5,969 | -5,851 | -4,983 | -5,237 | -4,422 |
| 2006 | -5,793 | -3,379 | -4,217 | -4,743 | -5,248 | -5,223 | -5,952 | -4,942 | -6,266 | -5,221 | -5,243 | -6,375 |
| 2007 | -4,829 | -4,650 | -6,659 | -5,912 | -5,415 | -4,985 | -5,594 | -5,711 | -5,974 | -6,864 | -6,780 | -6,377 |
| 2008 | -8,622 | -6,933 | -6,971 | -6,068 | -8,986 | -9,225 | -10,656 | -11,324 | -10,913 | -11,272 | -11,601 | -11,204 |
| 2009 | -13,404 | -11,980 | -11,967 | -12,084 | -14,472 | -17,494 | -17,375 | -18,851 | -17,560 | -17,857 | -17,527 | -18,972 |
| 2010 | -20,219 | -18,814 | -17,757 | -17,366 | -19,027 | -17,579 | -19,163 | -18,206 | -18,273 | -17,459 | -18,914 | -19,973 |
| 2011 | -22,360 | -18,690 | -19,537 | -18,307 | -19,904 | -18,993 | -20,479 | -19,159 | -19,706 | -21,049 | -20,736 | -22,216 |
| 2012 | -21,357 | -21,565 | -19,538 | -19,568 | -20,461 | -19,843 | -19,988 | -19,416 | -17,984 | -19,614 | -20,726 | -22,235 |
| 2013 | -20,803 | -19,485 | -18,679 | -17,569 | -17,206 | -18,348 | -20,428 | -20,457 | -20,513 | -21,228 | -21,419 | -23,961 |
| 2014 | -24,407 | -21,477 | -19,423 | -18,308 | -22,059 | -23,974 | -24,466 | -22,433 | -22,551 | -21,652 | -25,664 | -27,806 |
| 2015 | -22,853 | -22,783 | -23,931 | -22,683 | -23,458 | -24,313 | -25,077 | -21,414 | -22,231 | -21,292 | -26,508 | -27,912 |
| 2016 | -27,299 | -25,353 | -23,523 | -19,989 | -22,699 | -22,665 | -23,678 | -25,205 | -24,741 | -25,331 | -26,228 | -28,980 |
| 2017 | -28,858 | -24,498 | -27,242 | -24,841 | -25,926 | -24,332 | -26,278 | -27,792 | -27,271 | -24,808 | -26,465 | -29,115 |
| 2018 | -28,105 | -25,147 | -27,288 | -25,275 | -27,636 | -25,710 | -26,591 | -27,360 | -24,846 | -24,394 | -28,275 | -31,703 |
| 2019 | -30,068 | -22,680 | -26,537 | -23,979 | -21,544 | -24,679 | -28,200 | -28,551 | -27,845 | -27,118 | -28,967 | -30,436 |
| 2020 | -30,020 | -28,702 | -27,165 | -18,463 | -21,781 | -23,021 | -26,614 | -25,744 | -25,548 | -26,614 | -26,232 | -25,336 |
| 2021 | -29,539 | -26,787 | -28,677 | -23,493 | -25,099 | -28,780 | -29,023 | -29,870 | -30,534 | -29,356 | -29,542 | -34,831 |
| 2022 | -32,963 | -29,148 | -30,087 | -26,018 | -26,616 | -27,261 | -28,169 | -28,189 | -28,207 | -27,780 | -29,589 | -29,628 |
| 2023 | -31,154 | -29,066 | -29,664 | -27,958 | -28,079 | -29,210 | -30,643 | -31,066 | -31,336 | -33,029 | -30,079 | -35,332 |
| 2024 | -32,214 | |||||||||||
| - = No Data Reported; -- = Not Applicable; NA = Not Available; W = Withheld to avoid disclosure of individual company data. |
| Release Date: 3/29/2024 |
| Next Release Date: 4/30/2024 |