|
Download Data (XLS File) |
|
||||||||
|
||||||||
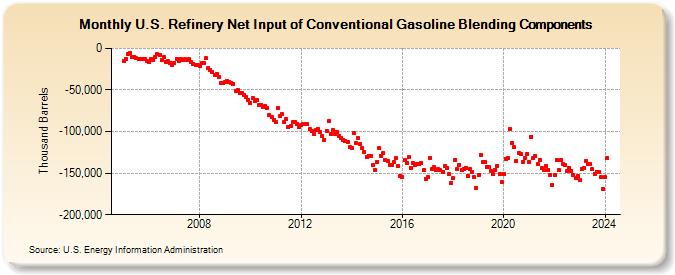
| U.S. Refinery Net Input of Conventional Gasoline Blending Components (Thousand Barrels) | ||||||||
| Year | Jan | Feb | Mar | Apr | May | Jun | Jul | Aug | Sep | Oct | Nov | Dec |
|---|---|---|---|---|---|---|---|---|---|---|---|---|
| 2005 | -15,601 | -12,485 | -6,719 | -5,576 | -10,849 | -10,394 | -12,142 | -12,550 | -12,484 | -13,274 | -13,135 | -14,619 |
| 2006 | -16,666 | -12,831 | -13,380 | -10,019 | -7,142 | -8,516 | -13,743 | -10,762 | -16,493 | -15,758 | -17,006 | -19,472 |
| 2007 | -17,518 | -12,600 | -14,811 | -12,282 | -14,502 | -13,071 | -13,784 | -13,219 | -16,384 | -18,293 | -20,071 | -20,295 |
| 2008 | -20,645 | -18,042 | -18,143 | -11,908 | -23,836 | -26,001 | -28,751 | -32,260 | -30,777 | -34,339 | -41,768 | -41,783 |
| 2009 | -40,958 | -38,974 | -40,902 | -41,839 | -42,625 | -51,098 | -50,247 | -54,116 | -53,070 | -56,476 | -58,711 | -62,157 |
| 2010 | -65,782 | -59,062 | -63,442 | -62,035 | -68,614 | -67,762 | -70,716 | -69,480 | -71,645 | -79,973 | -83,083 | -86,148 |
| 2011 | -88,609 | -71,814 | -81,779 | -79,114 | -88,551 | -84,919 | -94,433 | -93,834 | -88,973 | -88,636 | -90,339 | -94,697 |
| 2012 | -91,668 | -90,364 | -90,804 | -91,202 | -97,416 | -99,683 | -103,271 | -97,877 | -97,106 | -100,425 | -105,195 | -110,420 |
| 2013 | -98,892 | -87,594 | -102,770 | -98,510 | -103,123 | -100,625 | -105,883 | -107,695 | -110,188 | -111,860 | -112,654 | -119,056 |
| 2014 | -119,195 | -102,103 | -114,055 | -107,471 | -115,042 | -119,396 | -124,575 | -130,543 | -128,806 | -129,223 | -140,547 | -145,950 |
| 2015 | -136,260 | -120,243 | -129,338 | -125,606 | -134,301 | -135,146 | -140,794 | -139,986 | -136,783 | -132,400 | -141,325 | -153,239 |
| 2016 | -155,090 | -134,511 | -137,446 | -130,775 | -143,357 | -138,354 | -140,463 | -138,698 | -139,154 | -137,527 | -146,280 | -156,860 |
| 2017 | -154,372 | -131,432 | -144,735 | -143,043 | -145,683 | -145,357 | -146,567 | -148,934 | -141,841 | -143,790 | -150,816 | -161,448 |
| 2018 | -156,253 | -133,656 | -145,392 | -140,070 | -146,370 | -144,714 | -143,394 | -153,262 | -145,589 | -148,570 | -155,171 | -168,256 |
| 2019 | -152,076 | -128,665 | -136,643 | -136,594 | -142,534 | -143,089 | -147,590 | -151,559 | -145,685 | -141,192 | -151,073 | -161,227 |
| 2020 | -150,639 | -133,158 | -132,328 | -97,107 | -113,199 | -118,890 | -134,992 | -126,011 | -126,557 | -136,195 | -132,282 | -126,498 |
| 2021 | -136,708 | -105,966 | -132,167 | -128,926 | -138,852 | -134,019 | -143,785 | -146,289 | -141,659 | -146,081 | -152,582 | -164,713 |
| 2022 | -152,733 | -134,159 | -146,386 | -134,579 | -139,107 | -140,288 | -146,839 | -143,731 | -147,358 | -151,971 | -156,239 | -153,173 |
| 2023 | -158,735 | -144,500 | -144,091 | -134,926 | -139,380 | -138,915 | -145,619 | -150,674 | -148,177 | -148,287 | -155,230 | -168,575 |
| 2024 | -155,064 | |||||||||||
| - = No Data Reported; -- = Not Applicable; NA = Not Available; W = Withheld to avoid disclosure of individual company data. |
| Release Date: 3/29/2024 |
| Next Release Date: 4/30/2024 |