|
Download Data (XLS File) |
|
||||||||
|
||||||||
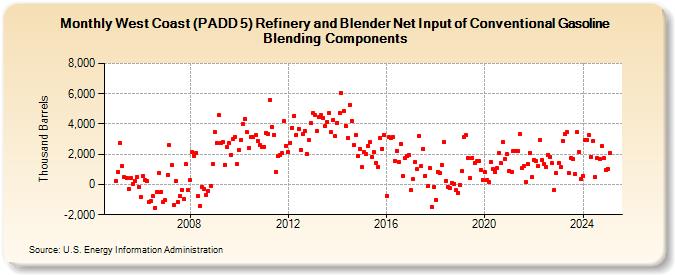
| West Coast (PADD 5) Refinery and Blender Net Input of Conventional Gasoline Blending Components (Thousand Barrels) | ||||||||
| Year | Jan | Feb | Mar | Apr | May | Jun | Jul | Aug | Sep | Oct | Nov | Dec |
|---|---|---|---|---|---|---|---|---|---|---|---|---|
| 2005 | 205 | 820 | 2,739 | 1,215 | 475 | 409 | -294 | 430 | 44 | 251 | 515 | -152 |
| 2006 | -855 | 584 | 281 | 220 | -1,150 | -1,100 | -780 | -1,523 | -484 | 763 | -482 | -1,133 |
| 2007 | -1,058 | 638 | 2,586 | 1,256 | -1,361 | 209 | -1,154 | -775 | -335 | -945 | 1,333 | -353 |
| 2008 | 266 | 2,150 | 1,904 | 2,105 | -771 | -1,420 | -175 | -284 | -674 | -424 | -70 | 1,362 |
| 2009 | 3,466 | 2,750 | 4,589 | 2,754 | 2,823 | 1,317 | 2,502 | 2,761 | 1,976 | 2,989 | 3,161 | 1,346 |
| 2010 | 2,306 | 2,951 | 3,997 | 4,343 | 3,442 | 2,407 | 3,132 | 3,110 | 3,241 | 2,905 | 2,608 | 2,509 |
| 2011 | 2,501 | 3,433 | 3,361 | 5,602 | 3,824 | 3,301 | 856 | 1,877 | 1,952 | 2,051 | 4,177 | 2,572 |
| 2012 | 2,146 | 2,775 | 3,755 | 4,545 | 3,289 | 3,658 | 2,281 | 3,320 | 3,541 | 2,047 | 2,917 | 4,041 |
| 2013 | 4,719 | 4,623 | 3,551 | 4,446 | 4,597 | 4,412 | 3,838 | 4,149 | 4,736 | 3,447 | 4,294 | 3,179 |
| 2014 | 4,087 | 4,744 | 6,057 | 4,885 | 3,899 | 3,099 | 5,276 | 4,212 | 2,603 | 3,241 | 1,893 | 2,374 |
| 2015 | 1,131 | 2,148 | 2,044 | 2,557 | 2,789 | 1,833 | 2,114 | 1,433 | 1,154 | 3,077 | 2,372 | 3,263 |
| 2016 | -733 | 3,106 | 3,083 | 3,142 | 1,540 | 2,246 | 1,497 | 2,705 | 553 | 1,727 | 1,856 | 1,976 |
| 2017 | -394 | 343 | 1,462 | 1,006 | 3,217 | 1,191 | 2,357 | 585 | -127 | 1,079 | -1,465 | -161 |
| 2018 | -1,013 | 850 | 743 | 1,301 | 2,818 | 232 | -175 | -248 | 125 | 64 | -393 | -536 |
| 2019 | -14 | 875 | 3,167 | 3,253 | 1,761 | 423 | 1,774 | 1,424 | 1,541 | 1,545 | 961 | 300 |
| 2020 | 822 | 313 | 162 | 1,508 | 1,000 | 843 | 1,057 | 2,070 | 1,398 | 2,799 | 1,682 | 1,988 |
| 2021 | 902 | 826 | 2,239 | 2,182 | 2,244 | 3,319 | 1,068 | 1,214 | 179 | 1,343 | 2,104 | 476 |
| 2022 | 1,648 | 1,540 | 1,207 | 2,951 | 1,617 | 1,349 | 1,123 | 1,941 | 1,827 | 1,401 | -342 | 763 |
| 2023 | 1,403 | 1,131 | 2,875 | 3,320 | 3,454 | 787 | 1,752 | 1,670 | 643 | 3,462 | 2,143 | 329 |
| 2024 | 583 | |||||||||||
| - = No Data Reported; -- = Not Applicable; NA = Not Available; W = Withheld to avoid disclosure of individual company data. |
| Release Date: 3/29/2024 |
| Next Release Date: 4/30/2024 |