|
Download Data (XLS File) |
|
||||||||
|
||||||||
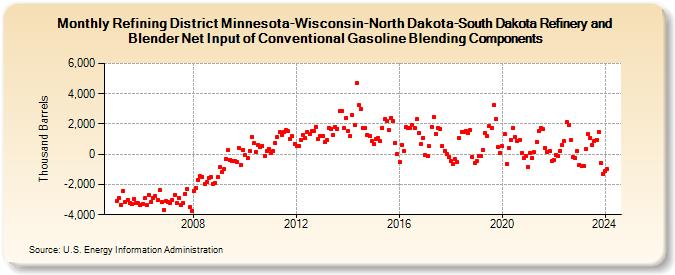
| Refining District Minnesota-Wisconsin-North Dakota-South Dakota Refinery and Blender Net Input of Conventional Gasoline Blending Components (Thousand Barrels) | ||||||||
| Year | Jan | Feb | Mar | Apr | May | Jun | Jul | Aug | Sep | Oct | Nov | Dec |
|---|---|---|---|---|---|---|---|---|---|---|---|---|
| 2005 | -3,120 | -2,915 | -3,341 | -2,423 | -3,174 | -3,002 | -3,227 | -3,306 | -2,958 | -3,201 | -3,237 | -3,389 |
| 2006 | -3,296 | -2,921 | -3,375 | -2,700 | -3,137 | -2,882 | -2,755 | -3,012 | -2,367 | -3,171 | -3,688 | -3,119 |
| 2007 | -3,167 | -3,255 | -3,008 | -2,678 | -3,226 | -2,914 | -3,351 | -3,196 | -2,613 | -2,284 | -3,507 | -3,746 |
| 2008 | -2,432 | -2,220 | -1,686 | -1,473 | -1,481 | -1,941 | -1,858 | -1,551 | -1,529 | -1,941 | -1,905 | -1,531 |
| 2009 | -866 | -1,192 | -997 | -284 | 260 | -350 | -476 | -436 | -504 | 402 | -716 | 281 |
| 2010 | -76 | -241 | 223 | 1,164 | 712 | 169 | 642 | 461 | 544 | -101 | 192 | 362 |
| 2011 | 51 | 225 | 727 | 1,166 | 1,451 | 1,280 | 1,454 | 1,614 | 1,506 | 1,038 | 1,185 | 705 |
| 2012 | 574 | 526 | 970 | 1,291 | 1,046 | 1,474 | 1,342 | 1,509 | 1,513 | 1,799 | 1,018 | 1,220 |
| 2013 | 1,234 | 801 | 945 | 1,719 | 1,656 | 1,297 | 1,784 | 1,668 | 2,834 | 2,890 | 1,749 | 2,419 |
| 2014 | 1,532 | 1,212 | 2,577 | 1,910 | 4,696 | 3,237 | 2,997 | 1,736 | 1,748 | 1,289 | 1,229 | 860 |
| 2015 | 659 | 1,004 | 1,068 | 869 | 1,749 | 2,304 | 2,164 | 1,581 | 2,412 | 2,165 | 764 | -13 |
| 2016 | -491 | 611 | 181 | 1,778 | 1,747 | 1,705 | 1,921 | 1,734 | 2,308 | 1,412 | 665 | 1,083 |
| 2017 | -59 | -150 | 526 | 1,821 | 2,453 | 1,348 | 1,750 | 1,668 | 546 | 239 | 26 | -189 |
| 2018 | -454 | -618 | -336 | -545 | 1,061 | 1,440 | 1,443 | 1,559 | 1,387 | 1,596 | -179 | -608 |
| 2019 | -454 | -144 | -116 | 273 | 1,412 | 1,209 | 1,881 | 1,709 | 3,233 | 2,304 | 494 | 106 |
| 2020 | 516 | 1,309 | -637 | 408 | 921 | 1,744 | 1,142 | 892 | 941 | 67 | -277 | -116 |
| 2021 | -871 | 112 | -252 | 128 | 828 | 1,545 | 1,751 | 1,638 | 433 | 135 | 207 | -448 |
| 2022 | -359 | -28 | -85 | 219 | 605 | 861 | 2,112 | 1,957 | 921 | -165 | -269 | 225 |
| 2023 | -689 | -796 | -763 | 356 | 1,310 | 1,097 | 617 | 849 | 961 | 1,479 | -567 | -1,337 |
| 2024 | -1,119 | |||||||||||
| - = No Data Reported; -- = Not Applicable; NA = Not Available; W = Withheld to avoid disclosure of individual company data. |
| Release Date: 3/29/2024 |
| Next Release Date: 4/30/2024 |