|
Download Data (XLS File) |
|
||||||||
|
||||||||
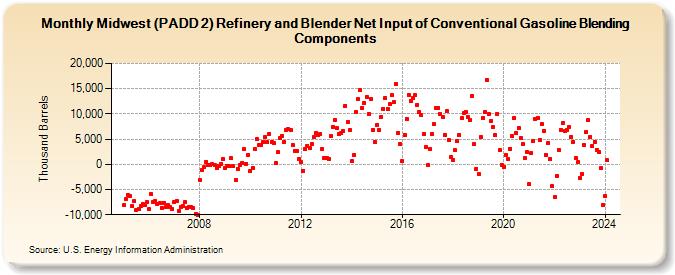
| Midwest (PADD 2) Refinery and Blender Net Input of Conventional Gasoline Blending Components (Thousand Barrels) | ||||||||
| Year | Jan | Feb | Mar | Apr | May | Jun | Jul | Aug | Sep | Oct | Nov | Dec |
|---|---|---|---|---|---|---|---|---|---|---|---|---|
| 2005 | -8,169 | -6,877 | -6,099 | -6,343 | -8,255 | -7,374 | -9,161 | -8,905 | -8,251 | -7,915 | -8,157 | -7,574 |
| 2006 | -8,963 | -5,902 | -7,387 | -7,259 | -7,934 | -7,732 | -8,589 | -7,578 | -8,518 | -8,129 | -8,540 | -8,926 |
| 2007 | -7,488 | -7,252 | -9,244 | -8,388 | -8,297 | -7,528 | -8,579 | -8,492 | -8,563 | -8,742 | -9,801 | -9,967 |
| 2008 | -3,171 | -1,214 | -602 | 531 | -57 | -52 | -24 | -196 | -638 | -285 | 99 | 1,086 |
| 2009 | -668 | -368 | -360 | 1,166 | -424 | -3,180 | -846 | -233 | 224 | 2,951 | 147 | 1,855 |
| 2010 | -1,256 | -780 | 2,966 | 5,004 | 3,806 | 3,740 | 4,511 | 5,411 | 4,400 | 6,103 | 4,451 | 4,165 |
| 2011 | 186 | 2,423 | 5,172 | 5,668 | 4,518 | 6,819 | 7,016 | 6,835 | 3,736 | 2,608 | 2,682 | 1,064 |
| 2012 | 426 | -1,279 | 3,010 | 3,705 | 3,292 | 3,970 | 5,335 | 6,292 | 5,798 | 6,071 | 3,055 | 1,172 |
| 2013 | 1,318 | 1,071 | 5,633 | 7,406 | 8,811 | 7,162 | 5,980 | 6,130 | 6,571 | 11,642 | 8,466 | 6,805 |
| 2014 | 689 | 1,891 | 10,345 | 12,951 | 14,707 | 11,214 | 12,257 | 13,448 | 10,001 | 12,976 | 6,870 | 4,422 |
| 2015 | 7,890 | 6,813 | 9,469 | 11,062 | 13,165 | 11,039 | 11,883 | 13,681 | 12,284 | 15,844 | 6,253 | 3,945 |
| 2016 | 684 | 5,853 | 8,989 | 13,776 | 12,560 | 13,057 | 13,708 | 11,779 | 10,407 | 9,801 | 6,039 | 3,432 |
| 2017 | -232 | 3,095 | 6,061 | 7,907 | 11,218 | 11,264 | 9,926 | 9,409 | 5,867 | 10,479 | 4,890 | 1,526 |
| 2018 | 822 | 2,761 | 4,597 | 5,857 | 9,135 | 10,204 | 10,449 | 9,462 | 8,830 | 13,567 | 4,060 | -838 |
| 2019 | -1,954 | 5,442 | 9,229 | 10,279 | 16,775 | 10,018 | 8,547 | 7,397 | 5,729 | 10,037 | 2,762 | -61 |
| 2020 | -552 | 1,874 | 976 | 3,128 | 5,557 | 9,171 | 6,187 | 7,208 | 5,305 | 3,957 | 1,325 | 2,423 |
| 2021 | -3,914 | 2,164 | 4,624 | 9,035 | 9,236 | 4,816 | 8,022 | 6,651 | 1,939 | 4,263 | 1,005 | -4,388 |
| 2022 | -6,584 | -2,320 | 2,899 | 6,841 | 8,194 | 6,599 | 6,882 | 7,430 | 5,451 | 4,514 | 1,161 | 397 |
| 2023 | -2,699 | -1,867 | 3,862 | 6,420 | 8,759 | 5,474 | 3,659 | 4,443 | 2,906 | 2,471 | -812 | -8,119 |
| 2024 | -6,300 | 798 | ||||||||||
| - = No Data Reported; -- = Not Applicable; NA = Not Available; W = Withheld to avoid disclosure of individual company data. |
| Release Date: 4/30/2024 |
| Next Release Date: 5/31/2024 |