|
Download Data (XLS File) |
|
||||||||
|
||||||||
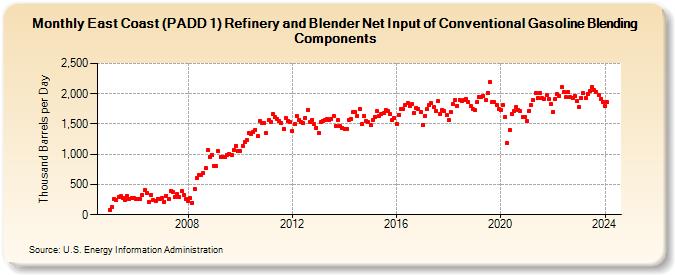
| East Coast (PADD 1) Refinery and Blender Net Input of Conventional Gasoline Blending Components (Thousand Barrels per Day) | ||||||||
| Year | Jan | Feb | Mar | Apr | May | Jun | Jul | Aug | Sep | Oct | Nov | Dec |
|---|---|---|---|---|---|---|---|---|---|---|---|---|
| 2005 | 79 | 126 | 266 | 245 | 300 | 305 | 279 | 246 | 317 | 263 | 273 | 271 |
| 2006 | 263 | 261 | 263 | 331 | 405 | 360 | 212 | 333 | 247 | 224 | 265 | 252 |
| 2007 | 274 | 216 | 317 | 261 | 400 | 374 | 299 | 336 | 295 | 395 | 322 | 263 |
| 2008 | 227 | 270 | 198 | 421 | 609 | 664 | 649 | 692 | 769 | 1,067 | 961 | 984 |
| 2009 | 810 | 800 | 1,047 | 956 | 952 | 948 | 982 | 1,006 | 992 | 1,077 | 1,136 | 1,061 |
| 2010 | 1,056 | 1,143 | 1,197 | 1,239 | 1,348 | 1,341 | 1,363 | 1,408 | 1,299 | 1,550 | 1,518 | 1,512 |
| 2011 | 1,346 | 1,558 | 1,527 | 1,657 | 1,615 | 1,589 | 1,557 | 1,522 | 1,423 | 1,601 | 1,555 | 1,535 |
| 2012 | 1,383 | 1,495 | 1,636 | 1,572 | 1,528 | 1,515 | 1,607 | 1,738 | 1,535 | 1,571 | 1,498 | 1,438 |
| 2013 | 1,356 | 1,526 | 1,550 | 1,570 | 1,589 | 1,564 | 1,579 | 1,625 | 1,470 | 1,561 | 1,465 | 1,438 |
| 2014 | 1,417 | 1,418 | 1,566 | 1,587 | 1,693 | 1,702 | 1,639 | 1,744 | 1,492 | 1,632 | 1,546 | 1,525 |
| 2015 | 1,491 | 1,570 | 1,615 | 1,707 | 1,631 | 1,665 | 1,675 | 1,732 | 1,707 | 1,659 | 1,569 | 1,599 |
| 2016 | 1,500 | 1,655 | 1,750 | 1,744 | 1,811 | 1,845 | 1,800 | 1,823 | 1,688 | 1,769 | 1,755 | 1,691 |
| 2017 | 1,489 | 1,632 | 1,745 | 1,810 | 1,840 | 1,780 | 1,722 | 1,872 | 1,669 | 1,738 | 1,712 | 1,652 |
| 2018 | 1,565 | 1,702 | 1,822 | 1,901 | 1,805 | 1,899 | 1,881 | 1,892 | 1,910 | 1,857 | 1,800 | 1,750 |
| 2019 | 1,724 | 1,865 | 1,948 | 1,949 | 1,963 | 1,889 | 2,020 | 2,195 | 1,864 | 1,857 | 1,808 | 1,741 |
| 2020 | 1,726 | 1,813 | 1,620 | 1,181 | 1,407 | 1,666 | 1,710 | 1,779 | 1,729 | 1,712 | 1,621 | 1,623 |
| 2021 | 1,544 | 1,716 | 1,820 | 1,899 | 2,011 | 1,927 | 2,015 | 1,925 | 1,915 | 1,972 | 1,921 | 1,834 |
| 2022 | 1,703 | 1,917 | 1,989 | 1,963 | 2,107 | 2,026 | 1,940 | 2,033 | 1,938 | 1,933 | 1,964 | 1,887 |
| 2023 | 1,784 | 1,931 | 2,011 | 1,928 | 2,002 | 2,041 | 2,103 | 2,064 | 2,026 | 1,976 | 1,916 | 1,866 |
| 2024 | 1,797 | |||||||||||
| - = No Data Reported; -- = Not Applicable; NA = Not Available; W = Withheld to avoid disclosure of individual company data. |
| Release Date: 3/29/2024 |
| Next Release Date: 4/30/2024 |