|
Download Data (XLS File) |
|
||||||||
|
||||||||
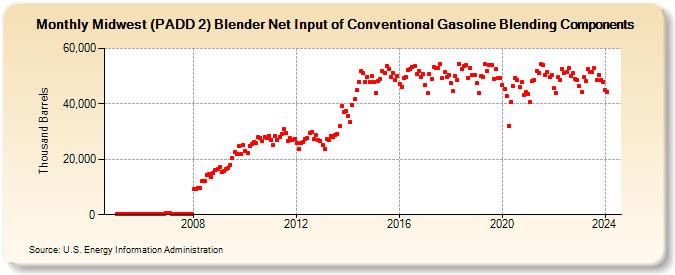
| Midwest (PADD 2) Blender Net Input of Conventional Gasoline Blending Components (Thousand Barrels) | ||||||||
| Year | Jan | Feb | Mar | Apr | May | Jun | Jul | Aug | Sep | Oct | Nov | Dec |
|---|---|---|---|---|---|---|---|---|---|---|---|---|
| 2005 | 254 | 236 | 260 | 251 | 256 | 293 | 293 | 299 | 262 | 285 | 276 | 322 |
| 2006 | 275 | 254 | 292 | 292 | 322 | 271 | 306 | 309 | 315 | 307 | 283 | 622 |
| 2007 | 571 | 447 | 376 | 307 | 280 | 331 | 348 | 380 | 345 | 371 | 419 | 356 |
| 2008 | 9,252 | 9,234 | 9,751 | 9,558 | 12,210 | 12,291 | 14,246 | 14,668 | 13,596 | 14,928 | 15,964 | 16,395 |
| 2009 | 17,104 | 15,391 | 15,708 | 16,670 | 16,982 | 18,026 | 20,395 | 22,549 | 21,826 | 24,655 | 21,831 | 25,052 |
| 2010 | 22,997 | 22,212 | 24,964 | 25,543 | 26,378 | 25,744 | 27,871 | 27,775 | 26,484 | 28,205 | 27,575 | 28,533 |
| 2011 | 27,088 | 25,162 | 28,407 | 26,861 | 28,044 | 28,993 | 30,845 | 29,453 | 26,748 | 27,587 | 26,944 | 27,356 |
| 2012 | 25,723 | 23,773 | 25,880 | 26,187 | 27,336 | 27,522 | 29,491 | 29,805 | 27,211 | 28,693 | 26,797 | 26,513 |
| 2013 | 25,102 | 23,622 | 27,341 | 26,996 | 28,444 | 28,058 | 28,772 | 29,282 | 31,835 | 39,218 | 36,986 | 37,554 |
| 2014 | 35,632 | 33,436 | 39,700 | 41,821 | 44,814 | 47,908 | 51,693 | 51,035 | 47,887 | 49,813 | 47,978 | 49,932 |
| 2015 | 48,001 | 44,058 | 48,355 | 48,977 | 52,016 | 51,238 | 53,702 | 52,688 | 49,796 | 51,146 | 48,535 | 49,970 |
| 2016 | 47,087 | 46,211 | 49,255 | 49,718 | 52,338 | 52,530 | 53,433 | 53,530 | 50,755 | 51,977 | 49,606 | 50,832 |
| 2017 | 46,867 | 43,950 | 50,938 | 48,953 | 53,215 | 52,961 | 52,966 | 54,318 | 49,376 | 51,313 | 49,741 | 50,513 |
| 2018 | 47,357 | 44,467 | 50,207 | 48,646 | 54,336 | 52,524 | 53,600 | 54,129 | 49,498 | 52,957 | 50,337 | 50,366 |
| 2019 | 47,497 | 43,758 | 50,201 | 49,857 | 54,213 | 51,861 | 54,133 | 54,041 | 48,917 | 52,419 | 49,306 | 49,192 |
| 2020 | 46,877 | 45,403 | 42,829 | 32,067 | 40,500 | 46,407 | 49,235 | 48,443 | 46,125 | 47,729 | 43,080 | 44,156 |
| 2021 | 43,399 | 40,620 | 48,349 | 48,570 | 51,950 | 51,302 | 54,335 | 54,032 | 50,367 | 51,416 | 49,636 | 50,346 |
| 2022 | 45,598 | 43,868 | 49,578 | 48,729 | 52,488 | 51,229 | 51,632 | 52,806 | 50,051 | 51,143 | 49,106 | 48,646 |
| 2023 | 46,362 | 44,342 | 49,506 | 48,319 | 52,484 | 51,337 | 51,471 | 52,859 | 48,596 | 50,565 | 48,584 | 48,053 |
| 2024 | 44,837 | |||||||||||
| - = No Data Reported; -- = Not Applicable; NA = Not Available; W = Withheld to avoid disclosure of individual company data. |
| Release Date: 3/29/2024 |
| Next Release Date: 4/30/2024 |