|
Download Data (XLS File) |
|
||||||||
|
||||||||
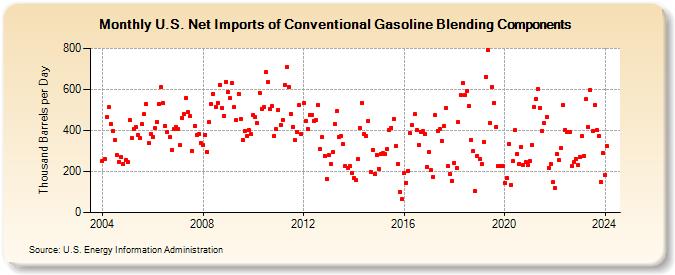
| U.S. Net Imports of Conventional Gasoline Blending Components (Thousand Barrels per Day) | ||||||||
| Year | Jan | Feb | Mar | Apr | May | Jun | Jul | Aug | Sep | Oct | Nov | Dec |
|---|---|---|---|---|---|---|---|---|---|---|---|---|
| 2004 | 251 | 260 | 464 | 512 | 430 | 398 | 356 | 279 | 248 | 270 | 237 | 257 |
| 2005 | 244 | 450 | 362 | 406 | 415 | 378 | 362 | 430 | 479 | 529 | 338 | 384 |
| 2006 | 368 | 410 | 443 | 528 | 610 | 532 | 422 | 393 | 367 | 307 | 405 | 416 |
| 2007 | 406 | 329 | 461 | 478 | 560 | 489 | 469 | 299 | 421 | 380 | 381 | 339 |
| 2008 | 327 | 380 | 297 | 439 | 527 | 579 | 514 | 534 | 624 | 509 | 472 | 638 |
| 2009 | 587 | 556 | 629 | 512 | 450 | 579 | 456 | 354 | 397 | 372 | 400 | 381 |
| 2010 | 475 | 464 | 435 | 584 | 507 | 513 | 683 | 634 | 503 | 519 | 375 | 405 |
| 2011 | 500 | 429 | 453 | 623 | 709 | 613 | 482 | 418 | 354 | 394 | 522 | 383 |
| 2012 | 532 | 444 | 407 | 476 | 477 | 448 | 450 | 523 | 309 | 366 | 278 | 165 |
| 2013 | 280 | 236 | 293 | 430 | 493 | 370 | 372 | 334 | 225 | 219 | 226 | 192 |
| 2014 | 168 | 157 | 260 | 411 | 536 | 384 | 372 | 448 | 198 | 307 | 189 | 281 |
| 2015 | 214 | 287 | 290 | 284 | 308 | 403 | 414 | 455 | 325 | 239 | 102 | 64 |
| 2016 | 191 | 146 | 204 | 386 | 425 | 478 | 402 | 329 | 395 | 396 | 382 | 223 |
| 2017 | 295 | 205 | 175 | 475 | 399 | 405 | 349 | 423 | 511 | 226 | 186 | 156 |
| 2018 | 243 | 216 | 440 | 572 | 629 | 572 | 592 | 519 | 356 | 298 | 103 | 274 |
| 2019 | 263 | 238 | 346 | 662 | 792 | 437 | 612 | 535 | 417 | 226 | 228 | 229 |
| 2020 | 146 | 169 | 335 | 136 | 250 | 401 | 287 | 239 | 320 | 234 | 247 | 233 |
| 2021 | 249 | 331 | 515 | 553 | 600 | 511 | 399 | 435 | 468 | 218 | 235 | 147 |
| 2022 | 122 | 286 | 255 | 313 | 523 | 403 | 395 | 394 | 226 | 245 | 262 | 234 |
| 2023 | 251 | 361 | 262 | 555 | 414 | 599 | 397 | 524 | 400 | 373 | 152 | 291 |
| 2024 | 182 | 322 | 311 | 440 | 400 | 503 | ||||||
| - = No Data Reported; -- = Not Applicable; NA = Not Available; W = Withheld to avoid disclosure of individual company data. |
| Release Date: 8/30/2024 |
| Next Release Date: 9/30/2024 |