|
Download Data (XLS File) |
|
||||||||
|
||||||||
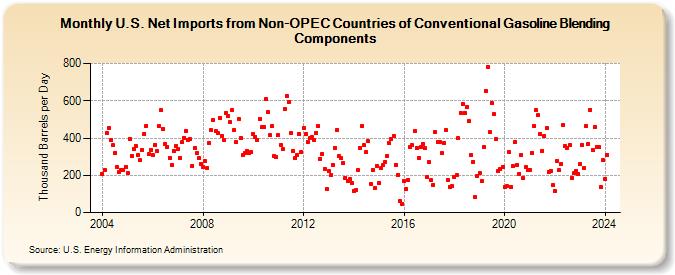
| U.S. Net Imports from Non-OPEC Countries of Conventional Gasoline Blending Components (Thousand Barrels per Day) | ||||||||
| Year | Jan | Feb | Mar | Apr | May | Jun | Jul | Aug | Sep | Oct | Nov | Dec |
|---|---|---|---|---|---|---|---|---|---|---|---|---|
| 2004 | 207 | 228 | 428 | 455 | 388 | 361 | 322 | 243 | 219 | 231 | 226 | 247 |
| 2005 | 211 | 394 | 303 | 343 | 357 | 308 | 280 | 335 | 424 | 467 | 312 | 337 |
| 2006 | 309 | 363 | 330 | 464 | 548 | 449 | 370 | 353 | 294 | 256 | 332 | 355 |
| 2007 | 342 | 294 | 376 | 402 | 438 | 392 | 393 | 252 | 347 | 317 | 291 | 261 |
| 2008 | 246 | 278 | 241 | 371 | 442 | 496 | 436 | 429 | 508 | 413 | 389 | 536 |
| 2009 | 517 | 484 | 548 | 442 | 377 | 502 | 401 | 308 | 320 | 333 | 318 | 324 |
| 2010 | 424 | 408 | 390 | 504 | 457 | 458 | 609 | 538 | 414 | 464 | 301 | 296 |
| 2011 | 414 | 363 | 339 | 557 | 626 | 592 | 426 | 329 | 295 | 311 | 422 | 325 |
| 2012 | 455 | 420 | 380 | 402 | 406 | 390 | 426 | 465 | 289 | 315 | 235 | 124 |
| 2013 | 221 | 199 | 257 | 348 | 444 | 302 | 291 | 265 | 187 | 172 | 179 | 158 |
| 2014 | 116 | 122 | 226 | 349 | 466 | 360 | 324 | 382 | 155 | 230 | 132 | 252 |
| 2015 | 161 | 237 | 253 | 273 | 303 | 372 | 394 | 411 | 257 | 202 | 63 | 47 |
| 2016 | 168 | 124 | 176 | 354 | 360 | 437 | 347 | 294 | 351 | 369 | 344 | 189 |
| 2017 | 269 | 173 | 150 | 433 | 378 | 379 | 317 | 371 | 441 | 175 | 138 | 140 |
| 2018 | 191 | 199 | 398 | 535 | 581 | 536 | 566 | 489 | 307 | 273 | 81 | 198 |
| 2019 | 213 | 168 | 353 | 654 | 782 | 430 | 588 | 527 | 393 | 223 | 235 | 245 |
| 2020 | 136 | 140 | 324 | 136 | 248 | 379 | 257 | 209 | 310 | 183 | 242 | 230 |
| 2021 | 230 | 321 | 465 | 548 | 521 | 423 | 332 | 411 | 453 | 218 | 224 | 147 |
| 2022 | 117 | 278 | 226 | 258 | 469 | 355 | 349 | 363 | 188 | 210 | 225 | 206 |
| 2023 | 260 | 364 | 239 | 464 | 368 | 553 | 338 | 459 | 352 | 354 | 135 | 280 |
| 2024 | 182 | |||||||||||
| - = No Data Reported; -- = Not Applicable; NA = Not Available; W = Withheld to avoid disclosure of individual company data. |
| Release Date: 3/29/2024 |
| Next Release Date: 4/30/2024 |