|
Download Data (XLS File) |
|
||||||||
|
||||||||
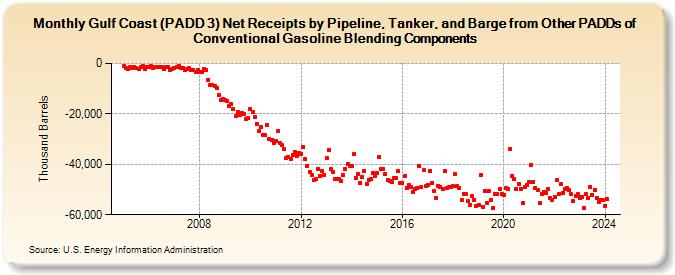
| Gulf Coast (PADD 3) Net Receipts by Pipeline, Tanker, and Barge from Other PADDs of Conventional Gasoline Blending Components (Thousand Barrels) | ||||||||
| Year | Jan | Feb | Mar | Apr | May | Jun | Jul | Aug | Sep | Oct | Nov | Dec |
|---|---|---|---|---|---|---|---|---|---|---|---|---|
| 2005 | -999 | -1,851 | -2,224 | -1,480 | -1,613 | -1,429 | -1,933 | -2,318 | -1,276 | -1,094 | -2,297 | -1,238 |
| 2006 | -1,311 | -1,117 | -1,817 | -1,433 | -1,404 | -1,331 | -1,446 | -2,181 | -1,479 | -1,512 | -2,537 | -2,095 |
| 2007 | -1,736 | -1,405 | -1,029 | -1,634 | -1,954 | -2,502 | -2,023 | -1,802 | -2,630 | -2,611 | -3,226 | -2,685 |
| 2008 | -3,408 | -3,237 | -2,270 | -2,514 | -6,431 | -8,602 | -8,704 | -8,757 | -9,788 | -12,607 | -14,572 | -14,225 |
| 2009 | -14,362 | -14,806 | -16,703 | -16,117 | -18,137 | -20,690 | -19,144 | -20,251 | -19,449 | -20,136 | -21,838 | -21,746 |
| 2010 | -18,173 | -19,114 | -21,348 | -24,013 | -26,856 | -25,343 | -28,327 | -28,235 | -24,309 | -30,094 | -30,461 | -31,405 |
| 2011 | -30,565 | -26,619 | -31,509 | -32,453 | -33,900 | -37,655 | -37,195 | -38,076 | -36,280 | -34,964 | -36,834 | -35,653 |
| 2012 | -35,867 | -33,215 | -38,036 | -40,563 | -43,125 | -44,073 | -46,187 | -45,909 | -41,696 | -44,835 | -42,570 | -44,046 |
| 2013 | -37,687 | -34,151 | -42,000 | -42,995 | -45,790 | -45,726 | -45,888 | -46,583 | -44,259 | -41,817 | -40,054 | -40,724 |
| 2014 | -40,536 | -36,092 | -45,248 | -43,754 | -47,252 | -44,931 | -42,501 | -47,878 | -46,225 | -45,951 | -43,542 | -44,758 |
| 2015 | -43,619 | -37,009 | -42,056 | -41,877 | -43,848 | -46,164 | -46,599 | -47,192 | -45,256 | -45,544 | -42,673 | -47,502 |
| 2016 | -47,345 | -44,642 | -49,459 | -48,108 | -49,184 | -51,047 | -49,879 | -49,370 | -40,802 | -49,010 | -42,329 | -48,738 |
| 2017 | -48,125 | -42,609 | -47,256 | -50,714 | -53,240 | -48,473 | -48,952 | -49,731 | -42,702 | -49,256 | -49,154 | -49,194 |
| 2018 | -48,729 | -43,942 | -48,641 | -49,365 | -54,284 | -51,602 | -51,962 | -54,690 | -56,241 | -52,731 | -53,997 | -56,356 |
| 2019 | -56,020 | -44,176 | -56,934 | -50,698 | -55,445 | -50,708 | -54,005 | -57,379 | -51,600 | -51,979 | -49,652 | -51,859 |
| 2020 | -52,000 | -49,218 | -49,715 | -34,034 | -44,730 | -46,019 | -49,658 | -47,763 | -49,825 | -55,368 | -49,087 | -48,013 |
| 2021 | -46,955 | -40,386 | -46,846 | -49,455 | -50,273 | -55,308 | -51,635 | -50,953 | -51,306 | -49,797 | -53,525 | -54,146 |
| 2022 | -53,014 | -46,374 | -51,893 | -48,005 | -51,188 | -49,984 | -49,530 | -50,328 | -51,684 | -54,654 | -52,413 | -51,848 |
| 2023 | -53,499 | -52,784 | -57,325 | -51,967 | -53,368 | -48,951 | -52,072 | -50,089 | -53,351 | -54,856 | -54,226 | -54,325 |
| 2024 | -56,410 | |||||||||||
| - = No Data Reported; -- = Not Applicable; NA = Not Available; W = Withheld to avoid disclosure of individual company data. |
| Release Date: 3/29/2024 |
| Next Release Date: 4/30/2024 |
Referring Pages: