|
Download Data (XLS File) |
|
||||||||
|
||||||||
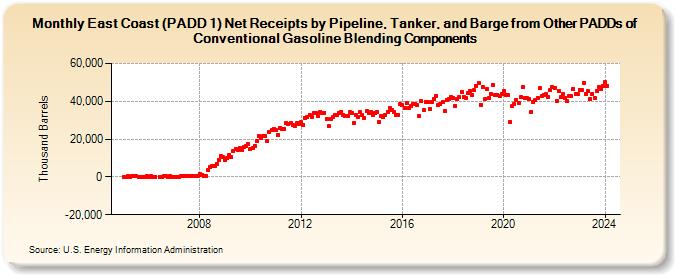
| East Coast (PADD 1) Net Receipts by Pipeline, Tanker, and Barge from Other PADDs of Conventional Gasoline Blending Components (Thousand Barrels) | ||||||||
| Year | Jan | Feb | Mar | Apr | May | Jun | Jul | Aug | Sep | Oct | Nov | Dec |
|---|---|---|---|---|---|---|---|---|---|---|---|---|
| 2005 | 22 | 117 | 418 | 184 | 282 | 228 | 326 | 206 | 15 | 31 | 112 | 216 |
| 2006 | -82 | 221 | 119 | 47 | 8 | 131 | 443 | 252 | 195 | 410 | 213 | |
| 2007 | 9 | 107 | 24 | 348 | 359 | 379 | 318 | 465 | 356 | 444 | 412 | 465 |
| 2008 | 1,322 | 1,163 | 587 | 617 | 3,393 | 5,433 | 5,615 | 5,855 | 7,087 | 8,880 | 11,023 | 10,281 |
| 2009 | 9,145 | 9,839 | 11,591 | 10,472 | 13,872 | 14,664 | 14,007 | 15,194 | 14,126 | 15,800 | 16,297 | 17,292 |
| 2010 | 14,824 | 15,204 | 16,547 | 19,019 | 21,716 | 20,779 | 21,479 | 21,748 | 18,769 | 23,794 | 24,711 | 25,598 |
| 2011 | 24,770 | 22,154 | 25,992 | 25,497 | 25,507 | 28,394 | 27,868 | 28,463 | 27,332 | 26,929 | 28,590 | 28,008 |
| 2012 | 28,835 | 27,681 | 30,973 | 31,438 | 32,992 | 31,663 | 34,062 | 33,575 | 32,044 | 34,563 | 33,690 | 34,018 |
| 2013 | 30,872 | 26,710 | 30,842 | 31,443 | 32,633 | 32,787 | 33,819 | 34,485 | 32,819 | 32,006 | 32,171 | 34,098 |
| 2014 | 34,038 | 28,548 | 32,996 | 31,756 | 34,262 | 32,514 | 31,213 | 34,698 | 33,886 | 34,438 | 32,918 | 33,906 |
| 2015 | 34,137 | 29,081 | 32,081 | 31,561 | 32,855 | 34,467 | 36,303 | 35,449 | 34,145 | 32,897 | 33,003 | 38,513 |
| 2016 | 37,801 | 36,707 | 39,073 | 36,342 | 37,304 | 38,656 | 38,683 | 38,078 | 32,149 | 40,119 | 35,429 | 39,784 |
| 2017 | 39,482 | 35,977 | 39,663 | 41,315 | 43,033 | 37,928 | 38,466 | 39,684 | 34,656 | 40,661 | 41,426 | 42,054 |
| 2018 | 41,909 | 37,537 | 40,970 | 42,140 | 44,960 | 42,276 | 41,924 | 44,281 | 45,453 | 43,575 | 45,826 | 48,299 |
| 2019 | 49,605 | 38,249 | 47,358 | 40,961 | 46,431 | 41,597 | 44,052 | 48,650 | 43,240 | 43,359 | 42,568 | 43,979 |
| 2020 | 45,585 | 43,188 | 43,165 | 29,195 | 37,494 | 38,463 | 40,676 | 38,973 | 42,110 | 47,305 | 41,750 | 41,606 |
| 2021 | 41,102 | 34,480 | 39,863 | 40,842 | 41,814 | 46,856 | 42,814 | 43,272 | 43,829 | 42,461 | 45,915 | 47,317 |
| 2022 | 46,790 | 40,299 | 45,254 | 42,151 | 43,749 | 41,753 | 40,049 | 42,970 | 42,769 | 46,404 | 43,895 | 43,698 |
| 2023 | 46,134 | 45,903 | 49,711 | 43,982 | 45,180 | 41,127 | 43,882 | 41,821 | 45,671 | 47,798 | 46,724 | 48,002 |
| 2024 | 50,131 | 48,160 | ||||||||||
| - = No Data Reported; -- = Not Applicable; NA = Not Available; W = Withheld to avoid disclosure of individual company data. |
| Release Date: 4/30/2024 |
| Next Release Date: 5/31/2024 |
Referring Pages: