|
Download Data (XLS File) |
|
||||||||
|
||||||||
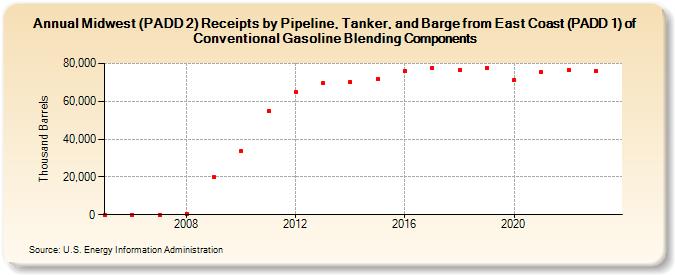
| Midwest (PADD 2) Receipts by Pipeline, Tanker, and Barge from East Coast (PADD 1) of Conventional Gasoline Blending Components (Thousand Barrels) | ||||||||
| Decade | Year-0 | Year-1 | Year-2 | Year-3 | Year-4 | Year-5 | Year-6 | Year-7 | Year-8 | Year-9 |
|---|---|---|---|---|---|---|---|---|---|---|
| 2000's | 105 | 0 | 0 | 606 | 19,890 | |||||
| 2010's | 33,637 | 54,909 | 64,780 | 69,705 | 70,315 | 72,027 | 76,208 | 77,708 | 76,626 | 77,777 |
| 2020's | 71,110 | 75,392 | 76,806 | 76,098 |
| - = No Data Reported; -- = Not Applicable; NA = Not Available; W = Withheld to avoid disclosure of individual company data. |
| Release Date: 4/30/2024 |
| Next Release Date: 8/30/2024 |