|
Download Data (XLS File) |
|
||||||||
|
||||||||
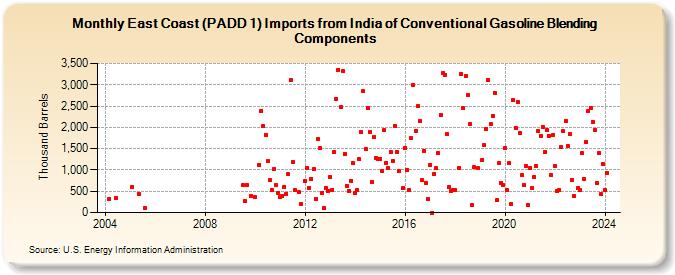
| East Coast (PADD 1) Imports from India of Conventional Gasoline Blending Components (Thousand Barrels) | ||||||||
| Year | Jan | Feb | Mar | Apr | May | Jun | Jul | Aug | Sep | Oct | Nov | Dec |
|---|---|---|---|---|---|---|---|---|---|---|---|---|
| 2004 | 324 | 342 | ||||||||||
| 2005 | 607 | 447 | 109 | |||||||||
| 2009 | 642 | 270 | 646 | 400 | ||||||||
| 2010 | 355 | 1,119 | 2,388 | 2,025 | 1,827 | 1,212 | 761 | 520 | 1,023 | 648 | 470 | |
| 2011 | 362 | 396 | 601 | 444 | 898 | 3,107 | 1,185 | 529 | 473 | 203 | ||
| 2012 | 747 | 1,042 | 588 | 789 | 1,013 | 327 | 1,738 | 1,506 | 464 | 98 | 575 | 507 |
| 2013 | 835 | 527 | 1,423 | 2,670 | 3,354 | 2,476 | 3,313 | 1,380 | 633 | 516 | 750 | 1,154 |
| 2014 | 461 | 520 | 1,251 | 1,884 | 2,843 | 1,486 | 2,453 | 1,896 | 713 | 1,775 | 1,291 | 1,263 |
| 2015 | 1,269 | 970 | 1,934 | 1,173 | 1,046 | 1,427 | 1,213 | 2,040 | 1,431 | 968 | 571 | |
| 2016 | 1,525 | 1,004 | 523 | 1,742 | 2,995 | 1,909 | 2,498 | 2,153 | 761 | 1,454 | 697 | 319 |
| 2017 | 1,117 | 1 | 914 | 1,037 | 1,393 | 2,292 | 3,268 | 3,236 | 1,840 | 591 | 516 | 518 |
| 2018 | 527 | 1,047 | 3,258 | 2,447 | 3,203 | 2,749 | 2,074 | 174 | 1,058 | 1,037 | ||
| 2019 | 1,244 | 1,576 | 1,962 | 3,106 | 2,069 | 2,275 | 2,809 | 284 | 1,173 | 705 | 636 | |
| 2020 | 1,508 | 525 | 1,168 | 201 | 2,633 | 1,987 | 2,596 | 1,861 | 874 | 640 | 1,091 | 189 |
| 2021 | 1,039 | 570 | 836 | 1,084 | 1,906 | 1,809 | 2,019 | 1,429 | 1,931 | 1,802 | 877 | 1,830 |
| 2022 | 1,085 | 517 | 526 | 1,530 | 1,907 | 2,158 | 1,565 | 1,843 | 762 | 392 | 587 | |
| 2023 | 518 | 1,389 | 796 | 1,657 | 2,390 | 2,463 | 2,131 | 1,942 | 695 | 1,403 | 427 | 1,150 |
| 2024 | 521 | |||||||||||
| - = No Data Reported; -- = Not Applicable; NA = Not Available; W = Withheld to avoid disclosure of individual company data. |
| Release Date: 3/29/2024 |
| Next Release Date: 4/30/2024 |