|
Download Data (XLS File) |
|
||||||||
|
||||||||
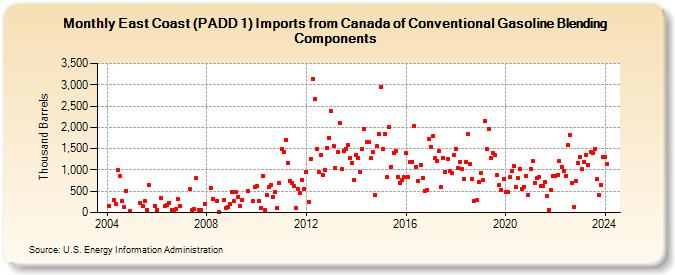
| East Coast (PADD 1) Imports from Canada of Conventional Gasoline Blending Components (Thousand Barrels) | ||||||||
| Year | Jan | Feb | Mar | Apr | May | Jun | Jul | Aug | Sep | Oct | Nov | Dec |
|---|---|---|---|---|---|---|---|---|---|---|---|---|
| 2004 | 152 | 302 | 205 | 1,003 | 853 | 263 | 134 | 513 | 48 | |||
| 2005 | 227 | 156 | 266 | 60 | 637 | 160 | ||||||
| 2006 | 50 | 345 | 162 | 186 | 214 | 70 | 50 | 88 | 307 | 161 | ||
| 2007 | 545 | 55 | 81 | 802 | 62 | 63 | 203 | |||||
| 2008 | 581 | 329 | 269 | 3 | 287 | 102 | 136 | 200 | ||||
| 2009 | 480 | 280 | 492 | 375 | 160 | 305 | 502 | 262 | 590 | |||
| 2010 | 629 | 265 | 104 | 868 | 60 | 406 | 602 | 649 | 373 | 486 | 100 | 693 |
| 2011 | 1,485 | 1,428 | 1,701 | 1,173 | 752 | 691 | 616 | 102 | 563 | 466 | 766 | 551 |
| 2012 | 953 | 249 | 1,255 | 3,144 | 2,662 | 1,493 | 948 | 1,359 | 891 | 1,009 | 1,525 | 1,754 |
| 2013 | 2,384 | 1,565 | 1,055 | 1,421 | 2,109 | 1,012 | 1,453 | 1,495 | 1,581 | 1,289 | 1,152 | 765 |
| 2014 | 1,359 | 1,289 | 944 | 1,496 | 1,953 | 1,667 | 1,666 | 1,279 | 1,422 | 418 | 1,552 | 1,854 |
| 2015 | 2,955 | 1,482 | 1,853 | 833 | 2,005 | 1,073 | 1,406 | 1,443 | 838 | 699 | 756 | 825 |
| 2016 | 1,402 | 826 | 1,198 | 1,195 | 2,032 | 1,079 | 739 | 1,115 | 820 | 515 | 524 | 1,720 |
| 2017 | 1,540 | 1,805 | 1,272 | 1,213 | 1,453 | 591 | 1,286 | 949 | 1,258 | 965 | 934 | 1,357 |
| 2018 | 1,496 | 1,054 | 1,195 | 1,027 | 790 | 1,192 | 1,837 | 1,140 | 789 | 270 | 286 | 726 |
| 2019 | 936 | 766 | 2,147 | 1,496 | 1,951 | 1,282 | 1,393 | 1,344 | 872 | 641 | 520 | 790 |
| 2020 | 475 | 483 | 824 | 985 | 1,096 | 590 | 813 | 1,018 | 551 | 607 | 863 | 415 |
| 2021 | 1,031 | 1,212 | 702 | 802 | 824 | 628 | 617 | 716 | 381 | 62 | 531 | 863 |
| 2022 | 860 | 888 | 1,210 | 1,078 | 964 | 869 | 1,586 | 1,819 | 689 | 130 | 741 | 1,166 |
| 2023 | 1,316 | 1,016 | 1,194 | 1,359 | 1,118 | 1,431 | 1,387 | 1,495 | 784 | 401 | 653 | 1,299 |
| 2024 | 1,311 | |||||||||||
| - = No Data Reported; -- = Not Applicable; NA = Not Available; W = Withheld to avoid disclosure of individual company data. |
| Release Date: 3/29/2024 |
| Next Release Date: 4/30/2024 |